Restoration Strategies Science Plan
The Science Plan for the Everglades Stormwater Treatment Areas (Science Plan), completed in 2024, was originally developed in 2013 and revised in 2018 as a framework to guide scientific research of key mechanisms and factors affecting phosphorus retention in the Everglades Stormwater Treatment Areas (STAs). Studies included in the Science Plan were developed primarily to support the design, operation, and management of STAs to achieve and sustain total phosphorus concentrations to meet the water quality-based effluent limit (WQBEL). The implementation of the Science Plan was mandated under Consent Orders (Office of General Counsel OGC Files No. 12-1148 and 12-1149) with the National Pollutant Discharge Elimination System (NPDES) and Everglades Forever Act (EFA) Watershed Permit (No. 0311207), issued in 2012 and amended in 2017 and 2022. The 2012 Restoration Strategies Regional Water Quality Plan identified a suite of projects designed to achieve the WQBEL, specifically flow equalization basins (FEBs), STA expansions and associated infrastructure, conveyance improvements, and Science Plan development and implementation.
The 21 Science Plan studies evaluated hydrologic, physical, chemical, and biological processes that affect total phosphorus concentrations discharged from the STAs to the Everglades Protection Area. Processes that affect STA performance and sustainability were considered. A list of key questions and sub questions based on knowledge gaps and uncertainties from the 2013 Science Plan was reevaluated and revised to reflect updated priorities in the 2018 Science Plan. The revised questions were based on information gained during the initial 5 years of implementation. New studies were added as a result of the 2018 revised Science Plan.
An improved understanding of P cycling, P retention, and factors reducing P retention within the STAs was gained from the studies undertaken and the questions answered through the implementation of the Science Plan. Much of this knowledge verified previous understanding of constructed treatment wetlands. The final report: Synthesis, Guidance, and Knowledge Gaps of the Science Plan for the Everglades Stormwater Treatment Areas, provides an overview and results of the Science Plan studies, and a set of proposed options that support management to achieve the WQBEL.
For more information, contact Tom James, SFWMD Principal Scientist.
Related Content
- Restoration Strategies Science Plan – April 2025 Update [PDF]
- 2018 Five-Year Work Plan [PDF]
- Original Science Plan (June 2013) [PDF]
- Original Detailed Study Plans (September 2014) [PDF]
- Overview of Projects and Findings – 2018 South Florida Environmental Report, Chapter 5C: Restoration Strategies Science Plan Implementation [PDF]
- Restoration Strategies Science Plan – Related Documents
- Restoration Strategies for Clean Water for the Everglades
- Water Quality Improvement
Completed Plan Studies
Use of Soil Amendments or Soil Management to Control Phosphorus Flux
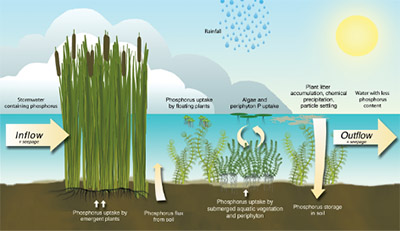
 The STAs have been constructed to a large extent on former agricultural lands. Once the STA cells are flooded, P in the soils can be released (flux) into the water column. This study was intended to screen methods that could reduce P flux from the flooded soil by application of soil amendments and/or management techniques. Effective methods may be useful at appropriate locations within the STAs to reduce outflow P concentrations.
Technologies to reduce soil-P flux in wetlands or lakes were reviewed from the literature and past SFWMD projects. The available technologies and soil amendments indicated that many potentially could lower P flux from flooded soils [1].
More Information can be found here:
Detailed Study Plan
Results
Soils in the STA-1W EA #1 Cell 7 were inverted as a remedial action to bury high copper concentrations that resulted from past agricultural practices. Soils in the adjacent Cell 8 were not inverted and were used as a control. Prior to flooding these cells, soils were collected and incubated to determine the amount of soluble P that could be released [2]. Phosphorus release from inverted soils was less than non-inverted soils. All STA-1W EA #1 cells have been flooded and the facility began treating water on a restricted basis in late June 2021. Weekly monitoring of P concentrations at Cell 7 and 8 inflow and outflow sites began in July 2021. Surveys of these wetland cells have shown similar soil TP concentrations, overlapping TP water concentrations, and differences in the type and distribution of plant [3].
While inversion appeared successful in laboratory studies, there were too many confounding conditions to determine if it was successful at the field scale.
- M. J. Chimney, Phase I Summary Report for the Use of Soil Amendments/ Management to Control P Flux Study. Technical Publication Wr-2015-006. South Florida Water Management District, West Palm Beach, Fl. (2015).
- MD Josan, Robert Tylor, and Kevin Grace, Evaluation of the Benefits of Soil Inversion in Minimizing Release of Phosphorus from Soil in Sta-1 West Expansion Area 1 (West Palm Beach, FL: South Florida Water Management District and DB Environmental, 2018), not online.
- M. J. Chimney, Use of Soil Amendments/Management to Control Phosphorus Flux (Soil Management Study). In Chapter 5c: Restoration Strategies Science Plan (James, R. T., C. Armstrong, J. King, S. Mason, T. Piccone and O. Villapando, Eds) in 2022 South Florida Environmental Report – Volume I. (2022).
Sustainable Landscape and Treatment in a Stormwater Treatment Area Study
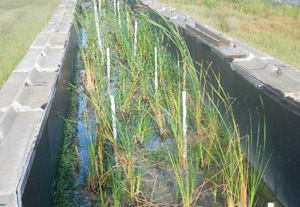 As evaluated in the Operations study, plant resistance to flow can affect the movement and mixing of water within an STA cell. To understand the relationships of plant density water depth and flow, more controlled conditions were used in this current study. The Landscape Study measured transport and dispersion of salt and phosphorus within a cattail community in a controlled (flume) environment to determine the flow volumes and velocities that optimize mixing based on water depth and plant densities. The effects of constant flow and pulsed flow on transport and dispersion also were measured.
Flow tests were carried out in two flumes, a V-shaped flume and a straight flume as a control. The flow velocity of water discharged at the top of the V-shaped flume decreases along the flume as the flume widens. This allows the measurement of multiple flow velocities at once on mixing.
Two tests were included in this study:
- Steady state flow – when flow in is equal to flow out, a specified amount of salt and phosphorus was added and measured along the flumes pathway to determine mixing and removal, respectively.
- Wave Tests – Wave and tracer/salt experiments were successfully completed for two pulse conditions at two water depths (0.5- and 1.25-ft). Data from the waves created within the flumes were used to measure vegetation resistance of flow within the flume. Added salt and TP were measured to determine mixing and removal.
These tests were repeated three times over a year: first with no plants as a baseline, second after cattail were planted and grew in for three months, and the third six months after planting of cattail resulting in higher densities of cattail. Thus, repeated experiments can compare results under different resistance regimes.
More information can be found here:
Statement of Work
Results
Low flow rates (below 50%) combined with shallow water were more effective in mixing of waters than high flow high water depths [1].
Pulsed waves at higher plant density and increased vegetation resistance resulted in higher transmissivity, surface water slope, and increased mixing. Further investigation of pulsing flows at the STA level should be evaluated.
Reports
- South Florida Engineering and Consulting LLC, Sustainable Landscape and Treatment in a Stormwater Treatment Area Draft Final Report C-4600004015-Wo01 (West Palm Beach, FL: SFEC, 2024).
Assess Feasibility and Benefits of Consolidating Accrued Marl in the Everglades Stormwater Treatment Areas
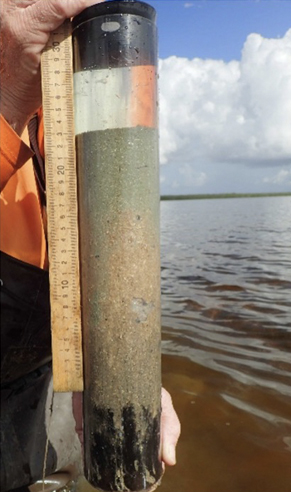 Marl is the primary soil type in submerged aquatic vegetation (SAV) dominated systems. It is produced when carbon dioxide is removed from calcium rich water by photosynthetic activity of both algae and aquatic macrophytes, resulting in the formation of particulate calcium carbonate which accumulates in soils as a primary component of marl. Some STA marl soils are physically unstable, allowing rooted macrophytes to be dislodged by wind/wave energy, while resuspension, bioturbation, and movement of unconsolidated marl material may increase water column turbidity and discharge total phosphorus (TP) concentrations. This study used sediment cores in lab experiments to measure erodibility of marl and organic soils and methods to enhance stability of these soils, which could lead to lower TP and turbidity in the water column.
Results
Marl soils had a wide range of organic matter, TP content, and physical stability across the STAs [1]. Organic soils from the STAs were less stable than marl soils. TP and turbidity typically increased in the water column after a suspension test to a greater degree in organic soils than marl. Consolidation of marl soils by drying increased stability. However this stability lasted no more than 12 weeks after rehydration. In addition, P flux increased in these dried soils after rehydration as compared to non-dried soils. The consolidation did have a benefit, it provided opportunity for faster SAV germination and regrowth.
Marl soils are likely not as ‘problematic’ for STA P retention as initially hypothesized, as they typically exhibit higher physical and chemical stability than more organic soils. These results suggest that reducing or limiting the coverage of emergent plants (such as cattail) near STA outflows may improve soil stability and reduce internal loading, both critical factors in achieving ultra-low water column TP concentrations.
More Information can be found here:
Project Work Plan
- DB Environmental, Assess Feasibility and Benefits of Consolidated Accrued Marl in the Everglades Stormwater Treatment Areas (Sta) Final Summary Report in Partial Fullfillment of Work Order 4600004012-Wo10r3 (Rockledge, FL: 2023).
Phosphorus Dynamics in the STAs
This study followed the Phosphorus Flux Study by investigating factors and mechanisms that affect treatment performance in underperforming Stormwater Treatment Areas (STAs), particularly key drivers affecting total phosphorus (TP) concentrations at the lower reaches of the treatment flow-ways. This study evaluated water, vegetation, soils, ultra-fine particulates, and microbially-mediated processes to understand factors and processes influencing STA performance in underperforming STA cells and in comparison to well-performing STAs. The goal was to improve management options to reduce total phosphorus (TP) discharge concentrations from the STAs.
Results
Historical analyses [1] found that for the three years after flow-ways experienced some major form of disturbance (construction, dryout, or major vegetation declines) annual FWM P outflow concentrations consistently exceed 19 µg/L. When disturbance free for more than three years and PLR outflow was less than or equal to 1.3 g/m2/yr, FWM P concentrations were consistently at or below 19 µg/L. This analysis and the data collected in this study did not find any significant differences between well performing and underperforming flow-ways other than disturbance and PLR. However, three STAs that were not overloaded in the past decade had the best properties for P retention kinetics in the soils [2]. All other major factors evaluated including transect trends of water column, floc, plant, soil P, and major P species (PP, DOP, SRP) were consistent between well performing and underperforming flow-ways. One difference was observed for wet season measurements of ultra-fine particulate SRP (between 3 k Daltons and 0.45 µm in size). In well-performing flow-ways, the percentage of <0.45 μm SRP present as ultrafine particulate SRP increased up to 100% as the distance from the inflow increased and the amount of truly dissolved SRP was very low [3].
More Information can be found here:
Study Plan Summary
- DB Environmental, Phosphorus Dynamics in the Stormwater Treatment Areas. Work Order 4600004012-Wo09r4. Deliverable 14a: Year 3 Quarter 12 Comprehensive Final Report (West Palm Beach, FL.: South Florida Water Management District, 2024).
- UF-WBL (University of Florida Wetland Biogeochemistry Laboratory), Phosphorus Dynamics in the Everglades Stormwater Treatment Areas: Evaluation of Biogeochemical Factors and Processes. Final Report. Work Order 4600004016-Wo04, South Florida Water Management District, West Palm Beach, Fl. (West Palm Beach, FL: South Florida Water Management District, 2024.
- A. Caroline Buchanan, Patrick W. Inglett, and Jonathan D. Judy, "Ultrafine (<0.45 Micron) Particulate P Fluxes Entering and Leaving Everglades Stormwater Treatment Areas as a Function of Sta Management and Performance" Ecological Engineering 194 (2023).
Data Integration and Analysis Study
The purpose of the Data Integration and Analysis Study (Data Integration Study) was to synthesize and summarize results from the Restoration Strategies Science Plan (Science Plan) [1] Studies and other STA scientific activities. This synthesis included reviews of Science Plan study documents and the key questions and subquestions from the Science Plan that they answered, a review of the fire project, historical water quality of the STAs, development of biogeochemical models. The final guidance and gap analysis provides a comprehensive understanding of phosphorus (P) dynamics within the Everglades Stormwater Treatment Area (STA) that affects P retention within these constructed wetlands [2]. This synthesis supports STA management and the Restoration Strategies Regional Water Quality Plan [3] to meet the Water Quality Based Effluent Limit (WQBEL).
More information can be found here:
Detailed Study Plan
Data Analyses
Comparing plant P and soil P and TP concentrations in water of outflow cells found that the lowest water column TP concentration occurred when moderate to high densities of musk grass (Chara spp.) were present [4]. Relationships of plant and soil P content to water column TP concentration were not as strong, however in studies using mesocosms (typically 1 meter diameter containers that include soils, plants, and inflowing and outflowing STA water) soil and plant tissue P content was related to outflow TP concentration.
Data compiled for each flow-way were analyzed over the period of record to determine annual flow-weighted mean outflow P concentrations in relation to major disturbances (dryout/reflood, loss of vegetation, construction) and phosphorus loading rate (P load/m2/yr) [5]. Outflow P concentrations were higher in years with disturbances than in years without disturbance. Furthermore, during years with no disturbance, when PLR was less than 1.3 g/m2/yr, outflow P concentrations were consistently less than 19 µg/L, while when PLR was greater than 1.3 g/m2/yr outflow P concentrations ranged above 19 µg/L.
Microbial Research Review
The microbial research in STAs with specific focus on periphyton (attached algae), processes, biomass, and enzyme activity were reviewed. Reduced mineralization in soils and enhanced enzyme activity in water column promoted lower TP outflow concentrations [6].
STA Evaluation
Monthly observed data for each STA for the period of record was compiled and this data was used to develop statistical structural equation models [SEMs] [7]. These models were used to determine if outflow TP concentrations were related to any of the 81+ monthly measurements taken in the STAs. Relationships varied among the STAs. There were no consistent relationships between inflow and outflow TP concentration among the STAs. Inflow TN concentration was positively correlated with the TP retention rate in STA-1W, and outflow TP concentration in STA-2. The relationship between Ca and P in STA-3/4 suggests the removal of P through co-precipitation with Ca.
Biogeochemical (BGC) and CASM Models
STA data and research from STA-2 FW1 was used to develop conceptual biogeochemical and CASM models that represent P cycling in the STAs [8]. While outflow TP was somewhat affected by external TP loads, internal flux from the soil to the water column had the greatest effect on outflow TP for the BGC model. P cycling was substantially influenced by periphyton. Optimal P removal occurred in the BGC model when water depth was 0.5 m, PLR was 0.5 mg/m2/yr. and HLR was 0.03 cm/day. This internal flux and precipitation of P were the dominate factors in the CASM model.
Fire Project Review
The Fire Project was a 6-year study undertaken to evaluate accelerated (by fire) and natural recovery of a wetland affected by high nutrient surface water loading resulting in a community shift from historic ridge and slough to cattail-dominated marshes.
Final Report and Gap Analyses
This final report was a compilation of studies carried out under the Science Plan [2] It was developed based on interviews with study leads, reviews of the major documents and results of each study, a tabulation of study answers to key questions and subquestions and any additional findings. Knowledge gaps were discussed with the study leads and others involved in the review of study results and tabulated in this final report. Finally, a table of potential options is included to provide guidance for management of the STAs.
References
-
SFWMD, Science Plan for the Everglades Stormwater Treatment Areas - Restoration Strategies Regional Water Quality Plan (West Palm Beach, FL: South Florida Water Management District, 2018), not online.
-
SFWMD, Synthesis, Guidance and Knowledge Gaps of the Science Plan for the Everglades Stormwater Treatment Areas (West Palm Beach, FL: South Florida Water Management District, 2024).
-
SFWMD, Restoration Strategies Regional Water Quality Plan - Final Version (West Palm Beach, FL: South Florida Water Management District, 2012).
-
DB Environmental, Data Integration and Analyses: Water, Vegetation and Soil Relationships in the Everglades Stormwater Treatment Areas. Prepared for South Florida Water Management District and Everglades Agricultural Area Protection District (Rockledge, FL: 2020).
-
DB Environmental, Phosphorus Dynamics in the Stormwater Treatment Areas. Work Order 4600004012-Wo09r4. Deliverable 14a: Year 3 Quarter 12 Comprehensive Final Report (West Palm Beach, FL.: South Florida Water Management District, 2024).
-
DB Environmental, Inc. Microbial Processes Affecting Phosphorus Removal and Retention in the Everglades Stormwater Treatment Areas. West Palm Beach, FL: South Florida Water Management District, 2021
-
Jing Hu et al., "An Analysis of Long-Term Everglades Stormwater Treatment Areas Performance Using Structural Equation Models " Ecological Engineering 198 (2023).
-
Coastal Ecosystems Inc., Cardno, and ESA, Development of Simulation Models for Everglades Stormwater Treatment Areas (Stas) Final Report Submitted to South Florida Water Management District in Partial Completion of Work Order: 4600004014-Wo05(2024).
Improving Resilience of Submerged Aquatic Vegetation in the Stormwater Treatment Areas
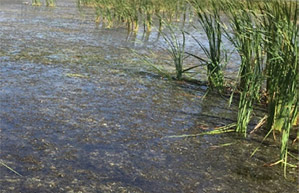 Submerged aquatic vegetation (SAV) communities in the STAs are important components of P retention. As CO2 is removed from the water column during photosynthesis, a chemical reaction occurs to form particulate CaCO3, which removes P from the water as a co-precipitant.
This study investigated SAV biology, water chemistry, soil chemistry, soil physical characteristics, herbivory, and their interactions to understand SAV species distribution, persistence, colonization, and recovery in STAs. Field surveys and experiments using mesocosms or enclosures evaluated the effects of marl, muck, and aged muck soils; hydraulic and P loading rates; drying out wetland soils; and fish herbivory.
More Information can be found here:
Detailed Study Plan
Results
Literature and data analyses found a number of factors can affect SAV growth, persistence, and sustainability. This included P and nitrogen loading, turbidity, Ca concentrations, water depth, sediment accretion, dry down/reflood events, wind/wave disturbance events, herbivory, and physiological senescence.
Results of SAV surveys found: 1) P content in SAV decreased from inflow to outflow along STA flow-ways, 2) Floating aquatic vegetation (FAV) encroachment into SAV areas, followed by herbicide treatment of FAV biomass, could reduce SAV densities and P removal performance, and 3) extreme environmental events (e.g., high flows, drawdown or cold temperatures) could change SAV community distribution [1].
Mesocosm experiments found that SAV grew well in muck, aged muck, and marl soils [1]. Plants grown on aged muck had the lowest plant tissue P suggesting reduced nutrient availability as soils in the STA age. SAV (Chara) did not grow as well with low P inputs than modest or high P inputs. Additionally, soils with high P content provided internal P inputs and Chara grew well even with low external P inputs. Additionally on the high P content soils less P is retained, and the outflow P concentrations were higher than for similar mesocosms grown on low P content soils.
Given high external or internal nutrient loads, Chara concentrates its biomass near the water surface, creating anoxic conditions in bottom waters. This anoxia could stress the SAV community and reduce P removal efficiency [1].
Germination and growth rates of SAV were higher than on soils previously dried than those that remained hydrated [1]. Shallow rooted SAV grew faster than deep rooted SAV in field enclosures [1]. Deeply rooted SAV grew faster in mixed plant communities than monocultures. Exotic nuisance fish (blue tilapia [Oreochromis aureus]) significantly reduced SAV growth.
References
- DB Environmental, Improving the Resilience of Sav in the Stas Final Summary Report; Submitted to South Florida Water Management District in Partial Fullfilment of Agreement 460004012-Wo08r2 (Rockledge, FL: 2023).
L-8 FEB AND STA Operational Guidance
The L-8 Flow Equalization Basin (FEB) is 950 acres in size and can store approximately 45,000 ac-ft of water. This FEB is used to reduce peak stormwater flows, temporarily store stormwater runoff, and improve water delivery to STA-1E and STA-1W. Improved water delivery should enhance STA performance to achieve Everglades water quality standards.
In water year 2018 (WY2018: May 2017 to April 2018), the flow weighted mean concentration (FWMC) of total phosphorus (TP) in outflow from the L-8 FEB was higher than inflow. Potential sources for this excess TP included groundwater, levee soil erosion, sediment resuspension, and P release from aquatic plants and animals. The objective of this study was to determine the potential sources of this excess TP and to provide operational guidance to limit the occurrence of higher TP outflow compared to TP inflow.
Results
TP concentrations in groundwater from wells surrounding the L-8 FEB were lower than observed in L-8 surface water samples, indicating that groundwater did not contribute to the intermittent high TP concentrations at the outflow site [1]. Particulate phosphorus (PP) was a major fraction of surface water TP suggesting that resuspended sediments are the source of PP in the water column.
Surface water quality was sampled monthly for one year and sediment and soils in and around the FEB were sampled once. Soils from the FEB banks had low TP content compared to benthic sediments suggesting that benthic sediments likely contributed to TP in water column [2]. Large flows of water at the inflow structure added significant nutrient loads, suspended materials and into the FEB. Additionally, these large flow events caused benthic sediments to resuspend into the water column [3]. These suspended particulates release dissolved P into the water column, which can then be converted into algal biomass resulting in temporarily elevated TP in the water column.
A multiple regression model using soluble reactive phosphorus (SRP) and turbidity was developed to predict TP to develop near real-time estimates of TP at the outflow of the FEB, using in-situ sensors of SRP and turbidity. This estimate can be used to make operational recommendations about the timing of water discharge from the FEB.
An alum feasibility study was carried out to determine the methods and costs of installing an alum addition treatment system to remove TP. Total cost over 10 years is estimated at $600 to $800 per lb of P removed [4].
References
- DB Environmental, L-8 Feb Surface Water and Groundwater Quality Monitoring, Deliverable #A3.5 Sampling Report. Prepared in Fulfillment of Contract 4600003883 on Inter-Agency Agreement to Conduct Scientific Studies Relevant to the Stormwater Treatment Areas (West Palm Beach, FL.: South Florida Water Management District, 2019).
- DB Environmental, L-8 Feb Targeted Surface Water and Sediment Assessment, Deliverable #A3.7 Sampling Report. Prepared in Fulfilment of Contract 4600004075 on Inter-Agency Agreement to Conduct Scientific Studies Relevant to the Stormwater Treatment Areas. (West Palm Beach, FL: South Florida Water Management District, 2020).
- DB Environmental, L-8 Feb Phase Ii Sampling Report 2: Event-Based Monitoring Results #A3.3 Sampling Report. Prepared in Fulfilment of Contract 460004012 on Inter-Agency Agreement to Conduct Scientific Studies Relevant to the Stormwater Treatment Areas (West Palm Beach, FL.: South Florida Water Management District, 2021).
- J Tech, L-8 Flow Equalization Basin Alum Treatment Feasibility Study Deliverable 4.10.2.1 – Technical Report Contract No. Cn4600003984 Wo 10 (West Palm Beach, FL: South Florida Water Management District, 2024).
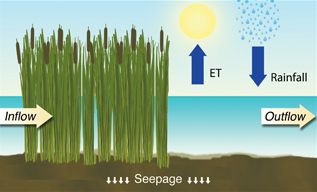
The Effect of Vertical Advective Transport (Positive Seepage) on Total Phosphorus Concentrations in the STAs
Description/Objective
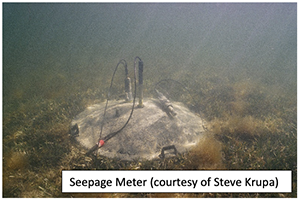
The purpose of the Advection study is to quantify the relative magnitude of vertical advective transport (positive seepage) of total phosphorus (TP) across the soil-water interface of Stormwater Treatment Area (STA) cells. The study focuses on outflow STA cells to determine if the internal TP load from positive seepage into the water column affects the low TP concentrations in these cells. In addition, the study evaluates management alternatives that may reduce or eliminate the positive seepage. The work will be completed in four phases:
Phase I is a feasibility study to examine if advection can have a significant influence on TP discharge concentration from the STAs. This phase includes three tasks:
- Literature review – to determine if seepage is a measurable factor of wetland water budgets and TP concentrations [1].
- Historical data analysis and water budgets – compile flow, rainfall, and evaporation data to develop water budgets for a select number of STA outflow cells. These will be analyzed to determine if seepage can be measured indirectly using water levels and conservative tracers. Evaluate water levels within and among surrounding STA cells to determine if differences and/or levels affect TP concentrations, which may indicate a seepage effect [2].
- Simple seepage model - A simple numerical model that simulates the hydrology and TP concentrations of an STA outflow cell will be constructed. A positive seepage and associated TP concentration (upward advective flow and TP load) will be added, and a sensitivity analysis conducted to determine the effects of seepage on TP concentration in the simulated STA cell [3].
STOP/GO – if Phase I determines that seepage can significantly affect STA cell water TP concentrations, then Phase II may begin.
Phase I did not demonstrate any significant seepage effects [3,4], therefore Phase II and subsequent planned phases were cancelled.
More information on the planned phases can be found here:
Detailed Study Plan
- WSP. 2022. The Effect of Vertical Advective Transport on Total Phosphorus Concentrations in the Stormwater Treatment Areas: Final Literature Review Report. Work Order 4600004323-WO06. Deliverable 2.2 submitted to the South Florida Water Management District.
- WSP. 2022. The Effect of Vertical Advective Transport on Total Phosphorus Concentrations in the Stormwater Treatment Areas: Final Water Balance Report. Work Order 4600004323-WO06. Deliverable 3.3 submitted to the South Florida Water Management District.
- WSP and Dynamic Solutions. 2022. The Effect of Vertical Advective Transport on Total Phosphorus Concentrations in the Stormwater Treatment Areas: Final A Simple Numerical Model Report. Work Order 4600004323-WO06. Deliverable 4.4 submitted to the South Florida Water Management District.
- S. Blair and R. Thomas James. 2024. Appendix 5C-3: The Effect of Vertical Advective Transport on Total Phosphorus Concentrations in the Stormwater Treatment Areas. South Florida Environmental Report. SFWMD. West Palm Beach, Fl.
Biomarker Study
Study Name: Quantifying the Recalcitrance and Lability of Phosphorus within Stormwater Treatment Areas
Description/Objective
 The Stormwater Treatment Areas (STAs) were created to decrease phosphorus (P) inputs into the Everglades. Phosphorus can come in many forms, some of which is associated with particles (particulate P) and organic matter (organic P). These forms of P may be stored in the soils and vegetation in the STA, consumed by organisms like fish and microorganisms and then recycled into other P forms (internal cycling), or exported to the Everglades.
To evaluate these P forms, this study used several sophisticated techniques (X-ray diffraction, 31P-NMR, ultrafiltration, and mass spectrometry) to determine their lability (see the Project Work Plan here). A pilot study initiated under the P-Flux study indicated that this approach could provide information on P sources and sinks within the STA [1]. Inflow and transects along two flow-ways were sampled for various organic carbon and P molecules using these specialized techniques. Photolysis and extraction of dissolved organic material (DOM) from litter bag experiments were also carried out.
The study found that inflow water DOM varied among the tributary watersheds [2]. Much of this DOM can be mineralized by the microbial community. Exposure to UV and sunlight breaks down this DOM and associated dissolved organic P (DOP) through a process called photolysis. The microbial community can enhance the photolysis as well. Polyphosphates and pyrophosphates, inorganic chains of P that are storage molecules created by microbial community, were found in soils of the STAs. This finding demonstrated the importance of the microbial community in the retention of P within these STAs. Litter bags that contained fresh plant material released DOM quickly. SAV litter not only released dissolved material faster but also released more orthophosphate than EAV litter. Thus, the DOM (and DOP) in STAs is primarily from litter decomposition of vascular plants (largely EAV).
-
Morrison ES, Shields MR, Bianchi TS, Liu Y, Newman S, Tolic N, Chu RK. 2019. Multiple biomarkers highlight the importance of water column processes in treatment wetland organic matter cycling. Water Res 168: 115153. Elsevier Ltd.
-
Morrison, E. S., J. H. F. Amaral, T. S. Bianchi, J. Gaddy, P. Inglett, P. Subedi, J. Judy, C. Buchanan, T. Z. Osborne, and K. R. Reddy. 2024. Quantifying the Recalcitrance and Lability of Phosphorus within Stormwater Treatment Areas (Biomarker Study) Submitted to the SFWMD in partial fulfillment of Work Order 4600004016 WO02.
Evaluation of the Influence of Canal Conveyance Features on Stormwater Treatment Area and Flow Equalization Basin Inflow and Outflow Phosphorus Concentrations
Description/Objective
Determine if phosphorus (P) concentrations change when water is conveyed through Stormwater Treatment Area (STA) and Flow Equalization Basin (FEB) inflow or outflow canals and evaluate factors that can influence these changes.
The study included two phases:
Phase I of this study reviewed and analyzed existing flow, stage, and water quality data.
Phase II of this study Investigated canal sediment characteristics (e.g. sediment thickness, sediment cores, and sediment chemical and physical composition) and canal cross section surveys, if needed.
More information can be found here:
Detailed Study Plan
Activities Completed and Status
This project was completed in 2017.
Phase I evaluation included six STA canals: STA-1 Inflow Basin Canal, STA-1 West (STA-1W) Discharge Canal, STA-2 Supply/Inflow Canal, STA-2 Discharge Canal, STA-3/4 Supply/Inflow Canal, and STA-1 East (STA-1E) Discharge Canal [3]. Total P (TP), soluble reactive phosphorus, particulate phosphorus (PP), dissolved organic phosphorus, chloride, and total suspended solids were evaluated for each canal.
Phase II sediment characterizations were measured in the STA-2 Supply/Inflow Canal. This phase was completed in February 2017.
Results
The STA-1 Inflow Basin Canal was a source of TP during peak flows, primarily in the form of PP. With the implementation of an upstream flow-equalization basin (L-8 FEB), these peak flows are expected to decrease, reducing the potential for sediment resuspension and transport [1].
The STA-1W Discharge Canal was a sink for TP, with much of the it being deposited as PP. After STA-1W expansion is constructed, the STA-1W Discharge Canal will no longer serve as the discharge canal for the STA. Therefore, no further evaluation is recommended.
The STA-2 Supply/Inflow Canal receives water from the S-6 pump station and G-328 pump station, with relatively high TP concentrations from stormwater runoff, and G-337, with relatively low TP concentrations from STA seepage water. When S-6 flows dominated, the canal behaved as a TP sink. When G-337/G-328 flows dominated the canal behaved as a TP source [2]. A canal survey indicated sediment buildup in the canal bottom and notable erosion from canal side-slope areas. Future canal surveys (e. g. every three to five years) are recommended.
The STA-2 Discharge Canal was neither a sink nor a source of TP, while the STA-3/4 Supply/Inflow Canal was a TP and PP sink. No further evaluation is recommended on these canals. A review of the data for the STA-1E Discharge Canal indicated that TP concentrations did not increase in the canal; no further evaluation is recommended.
Reports and Publications
- Zhao, H. T. Piccone and S. Hill. 2016. STA-1 Inflow Basin Canal Final Report. Technical Report WR-2015-004. South Florida Water Management District. West Palm Beach, FL.
- Zhao, H. T., O. Diaz and T. Piccone. 2017. Stormwater Treatment Area 1 West Discharge Canal Evaluation Report Technical Report WR-2017-005. South Florida Water Management District. West Palm Beach, FL.
- Zhao, H. T., T. Piccone and O. Diaz. 2015. Supporting Information for Canal Evaluations Technical Report WR-2015-003. South Florida Water Management District. West Palm Beach, FL
Evaluate Phosphorus Sources, Forms, Flux and Transformation Processes in the Everglades Stormwater Treatment Areas
Description/Objective
To understand how Phosphorus (P) is processed and removed within well performing Stormwater Treatment Areas (STAs), this multi-component study evaluated mechanisms and factors affecting P reduction from the water column particularly in the outflow regions of the STAs. The study measured flow-way (FW) water quality, internal phosphorus loads, soil, microbial enzymes, vegetation, particulate transport and settling, fauna, and organic P speciation. In addition, these data were synthesized to explain factors and processes influencing STA performance and will serve as the basis to develop or improve management options to reduce total P (TP) discharge concentrations from the STAs.
More Information can be found here:
Detailed Study Plan
Activities Completed, Results and Current Status
The Study was completed in 2019
Vegetation type, depth in the profile and distance from the inflow affected P sorption and desorption. The floc and RAS were more reactive than underlying soils. SAV-dominated sites generally exhibited a greater potential to retain P at low surface water P concentrations, than EAV-dominated sites. No trend was found for P sorption or desorption from the inflow to the outflow regions. P desorption tended to be higher for EAV than SAV-dominated sites. P sorption was strongly related to extractable and total Fe and Al for EAV-dominated FWs, and Ca and Mg in SAV-dominated FWs.
EAV in STA-2 had higher concentrations of P, N and C in plant material compared to SAV. Of the SAV species, Chara had the highest nutrient storages of all species. EAV biomass and performance were consistent throughout the study in FW 1 while FW 3 experienced a decline in performance following the significant loss of SAV.
- Flow-way Water Quality Assessment: P cycling in three well-performing STA FWs was evaluated under high, moderate, low and no flow conditions. TP concentrations were high at the inflow region--consisting primarily of inorganic phosphate--and low at the outflow region--consisting primarily of particulate P (PP) and dissolved organic P (DOP). These results were consistent for all flow conditions in all FWs. More P was removed from the water column of emergent aquatic vegetation (EAV) regions than submerged aquatic vegetation (SAV) regions. In SAV regions, TP increased under no flow condition--primarily as particulate P (PP)--which could be from internal loads caused by periphyton sloughing, litter fragmentation, or bioturbation. P concentrations were slightly higher in SAV systems than in EAV systems under no flow condition.
- Flux Measurements: P concentrations in field chambers increased during no flow periods, indicating internal P loading from vegetation mining of soils and turnover. This increasing P trend, evaluated with a computer model, suggested that internal loading was a significant contributor to the P cycle. Internal loading was highest at inflow regions and lowest in outflow regions of the FWs.
- Soil P Characterization: P concentrations in floc and recently accreted soils (RAS) declined from higher values at the inflow regions to low values at the outflow regions. Phosphorus in floc and RAS was higher and more spatially extensive in EAV than SAV areas of the STAs. The decreasing trend of P from inflow to outflow resulted in increasing trend of N:P ratio from inflow to outflow. P was primarily in an organic form in EAV and inorganic mineral form in SAV areas. P accretion rate was higher in SAV than in EAV due to accumulation of material high in inorganic matter.
- Microbial Enzymatic Patterns: Within the STA flowways, the microbial communities play an important role in nutrient cycling, especially when nutrient limiting conditions exist. Required nutrients (i.e., C, N, or P) can be released from the dissolved organic compounds by enzymes produced by the microbes. Enzyme activity--a measure of microbial community activity--was affected by flow conditions among each component and differing responses were observed along the flowways and within the vegetation communities. The level of enzyme activity was highest in the periphyton and lowest in the surface water. Enzyme activity in the surface water during flow conditions, was often undetectable. With regard to enzyme response and nutrient conditions, flow resulted in more N-limited conditions in the EAV areas for floc and more P-limited conditions in the SAV areas. In the periphyton, C-limited conditions increased during flow in the EAV areas, but an opposite effect was observed in the SAV areas. In both plant communities, N-limiting conditions in the periphyton was greatest during no flow periods. In both the floc and periphyton, greatest P-limiting conditions were observed at the outflow locations. These variable responses indicate that flow conditions have a complex effect on the microbial responses within each component and that nutrient limiting conditions change along the flowways and within the major components.
- Vegetation Assessments: Satellite images of STA areas in wet and dry seasons detected differences in SAV and EAV spectral signatures. SAV areas dominated by a single species, specifically Chara, could be accurately identified. Mixed SAV species beds were more difficult to distinguish. When cross-validated with ground observations, the spectral analysis correctly classified 96% of reference samples.
- Particulate Transport and Settling: Water velocities in the STAs are affected by gate operations, wind, and distance to remnant agricultural canals and ditches, with highest velocities near inflow and outflow structures and remnant canals/ditches. Inflow regions had the highest observed sediment settling/resuspension and net accumulation rates. Measured net P accumulation rates into floc were similar in magnitude to net P storage estimated from mass balance for STA-2 FW 3. STA-3/4 Cell 3B had lower storage rates, which is attributed to lower accumulation, higher erosion, and/or more spatial variability at this cell’s inflow regions. At relatively low and stable water velocities (< 0.5 cm/s), water column particulates likely originate from sloughed SAV biomass rather than sediments and are caused by wave related stress rather than flow driven stress. PP resuspension and settling measurements in SAV areas are approximately 10 times higher than total P loading and accumulation rates derived from mass balance. Therefore, the potential for large swings in P storage or loss may be expected depending on the factors that drive these fluxes.
- Fauna Study: STA fish nutrient content and nutrient ratios were similar to values reported for enriched areas of Water Conservation Area 2A. Fish tissues contained an estimated 1 metric ton of TP and 3.7 metric tons of TN in STA-2 Cells 3, 4, 5, and 6. Because of the substantial fish population, further analyses on the contribution of fauna to the water column P in the outflow regions of STAs is being investigated as a separate Fauna Study.
- Organic P Speciation: Biomarkers (lignin phenols, amino acids, and pigments) as a measure of organic matter (OM) quality were compared between STA-3/4 and a reference wetland WCA-2A. More vascular plant-based OM was found in EAV areas, and more algal-based OM was found in SAV areas. OM was fresher and more degradable in treatment SAV sites than reference wetland sites. Other than dense cattail areas, water column particulate OM in SAV areas was primarily from microbial sources. Amino acid degradation indices and organic P were positively correlated with bacterial amino acid biomarkers, suggesting microbial abundance was associated with “fresher” OM. This multi-biomarker approach may evaluate the relative “freshness” of OM pools, identify sources of OM, and provide relative measures of water column processes in P cycling in STAs. Due to the significant results further analysis is being conducted under a separate Biomarker Study.
- Data Synthesis and Integration: This effort focused on two major approaches. One using a numerical version of a conceptual model that incorporated a number of different (yet connected) data sets. This “bottom up approach” model identifies specific fluxes and transformations among major P reservoirs within the STAs. When integrated with existing data, key processes (settling, resuspension, etc.) were captured well with a better model-data match for EAV than for SAV. The “top down approach” model focused on two major controlling variables, internal load and flow. This model evaluated transect data and the effects of varying flows on outflow P concentrations. Model results suggest that internal loading and flow affected outflow P concentration dynamics. Further synthesis and integration beyond the P Flux study is being conducted in the Data Integration Study.
Reports and Publications
2. DBE, 2018 Field and Supplemental Laboratory Support for Evaluating Phosphorus Sources, Flux, and Transformation Processes in the Stormwater Treatment Areas – Annual Report. Prepared by DB Environmental, Inc. under Agreement 4600003029-WO01 for South Florida Water Management District, West Palm Beach, FL.
3. DBE, 2019, Field and Supplemental Laboratory Support for Evaluating Phosphorus Sources, Flux, and Transformation Processes in the Stormwater Treatment Areas – Annual Report. Prepared by DB Environmental, Inc. under Agreement 4600003029-WO01 for South Florida Water Management District, West Palm Beach, FL.
7. DBE, 2017, Field and Supplemental Laboratory Support for Evaluating Phosphorus Sources, Flux, and Transformation Processes in the Stormwater Treatment Areas – Annual Report. Prepared by DB Environmental, Inc. under Agreement 4600003029-WO01 for South Florida Water Management District, West Palm Beach, FL.
8. University of Florida, 2019 Evaluation of Soil Biogeochemical Properties Influencing Phosphorus Flux in the Everglades Stormwater Treatment Areas (STAs) Final Report. Submitted to South Florida Water Management District, West Palm Beach, FL.
9. Gann, D., M. Bernardo, and J. Richards, 2019, Detection and Differentiation of Submerged Aquatic and Emergent/Floating Marsh Vegetation using Remote Sensing Methods -- Spectral Separability from WorldView Data (Pilot Study). Report Submitted to the South Florida Water Management District, West Palm Beach, FL.
10. Florida International University, 2019, Settling and Entrainment Properties of STA Particulates Draft Final Report. Prepared under Agreement No. 4600003032-WO02-9500006758 for South Florida Water Management District,. West Palm Beach, FL.
Development of Operational Guidance for Flow Equalization Basins and Stormwater Treatment Area Regional Operation Plans
 Description/Objective
Management of water flow into the STAs is critical to maintain Stormwater Treatment Areas (STAs) to achieve their objective. This study developed tools and methods to support regional operation plans and guidance to optimize the use of Flow Equalization Basins (FEBs) and distribution of flow to the STAs to achieve the Water Quality Based Effluent Limits for Total Phosphorus (TP).
The study included three tasks:
- Evaluate relevant information on STAs and conduct field tests to evaluate hydraulics and water quality.
- Define values for model equations needed to simulate hydraulics, hydrology and operational control of STAs.
- Develop local (STAs/FEBs) and regional operating strategies and rules and application of system optimization tools.
More information can be found here:
Detailed Study Plan
Activities Completed and Current Status
The study was completed in 2017.
Field measurements of waves propagated by inflow discharges to STA-3/4 Cell 3A were evaluated in relation to low, medium and high flow rates and water depth. Wave speeds and heights along flow paths were used to calculate vegetation resistance to flow. Maps of flow and resistance were created using the equations that described resistance at different flow rates. A total variation diminishing Lax-Friedrichs (TVDLF) method was used in a simple model to simulate flow-through hydraulic gradients of STA flow-ways based on real-time water elevation observations and flows. An inverse model (iModel) for Restoration Strategy Operational Protocol (RSOP) was developed to optimize flow rates along the Central Flow Path for proper flow attenuation and treatment with and without the FEB.
Results
Field tests improved water depth estimates and residence times in real-world applications leading to improved accuracy of physically based models of the STAs. The patterns of resistance produced from these applications reflected the general patterns of the vegetation distribution. The applications represented vegetation resistance, topography effects, resistance due to blockages, short-circuiting and turbulent behaviors. This information can assist project planning and design. The values in the model equations can determine if the flow behaves like porous-media flow or short-circuiting stream flow. The simple TVDLF method can forecast seven-day predictions of water depths under multiple management scenarios/flow regimes. At present this tool assists the management of the western flow-way of STA-3/4.
The iModel-RSOP was applied to four alternative scenarios of different FEB and Lake Okeechobee water delivery configurations. By rearranging flow to optimize TP removal, the iModel predicted lower TP concentration in discharge for all the scenarios compared to observed values. While the iModel results are encouraging, many difficulties were encountered to provide an accurate statistical prediction of TP concentration suggesting room for improvement.
Reports and Publications
- Ali, A. 2015. Multi-objective operations of multi-wetland ecosystem: iModel applied to the Everglades restoration. Journal of Water Resources Planning and Management 141(9).
- Ali, A. 2018. Appendix 5C-1 iModel for Restoration Strategy Operational Protocol Development. In: 2018 South Florida Environmental Report – Volume I, South Florida Water Management District, West Palm Beach, FL.
- Lal, A. M. W. 2017. Mapping Vegetation-Resistance Parameters in Wetlands Using Generated Waves. Journal of Hydraulic Engineering 143(9).
- Lal, A.M., M.Z. Moustafa and W. Wilcox, 2015. The use of discharge perturbations to understand in-situ vegetation resistance in wetlands. Water Resources Research 51:2477-2497; doi: 10.1002/2014WR015472.
Investigation of STA-3/4 Periphyton-based Stormwater Treatment Area Performance, Design and Operational Factors
 Description/Objective
Investigate performance, design elements, operation and biogeochemical characteristics that have enabled the 100-acre PSTA Cell to achieve ultra-low outflow total phosphorus (TP) concentrations.
This study includes monitoring and surveys within the cell, as well as mesocosm and microcosm experiments that supplement these studies. Continuous TP measurements at inflow and outflow locations of the cell were also conducted.
More information can be found at:
Detailed Study Plan
Activities Completed and Current Status
The study was completed in 2018. Inflow and outflow monitoring is ongoing.
Inflow and outflow concentrations of TP and flows into and out of the cell were monitored continuously. Grab surface water samples taken at the structures were analyzed for various P species. Other data measured periodically within the PSTA Cell included conductivity, pH, temperature, dissolved oxygen, chlorophyll a, turbidity, water depth, light and ion concentrations. Effects of pulse flows, season, time of day, water depth, inflow P concentration, flow rate and seepage on cell performance were evaluated. Enzyme assays were also conducted to evaluate the role of microbial activity. Sediment accrual and vegetation nutrient contents were also analyzed. Reports and manuscripts have been completed. Final analyses will be reported in the 2019 South Florida Environmental Report.
Results
The PSTA Cell achieved annual outflow flow-weighted mean TP concentrations ranging from 8 to 13 µg/L for the period of record (2008 to 2017). Pulse flow events and associated higher P loads had no adverse effect on treatment performance. Outflow TP concentrations were not affected by two different operational water depths (average of 0.39 m and 0.55 m) the time of day, or longer periods of constant moderate flow. Generally, lower outflow TP concentrations were observed during the wet season. The optimal inflow TP concentrations to the PSTA Cell is 22 µg/L or less, which achieved outflow concentration of 13 µg/L or lower. Lateral seepage through the levee between the Lower Submerged Aquatic Vegetation (SAV) Cell and the PSTA Cell was the major source of seepage. The accumulated sediment in the cell is low in P and chemically stable, resulting in sustained P removal performance.
Reports and Publications
- James, R.T. 2015. Evaluation of Remote Phosphorus Analyzer Measurements and Hydrologic Conditions of the STA-3/4 Periphyton-based Stormwater Treatment Area. Technical Publication WR-2015-002. South Florida Water Management District, West Palm Beach, FL.
- James, R.T. 2017. Analysis of Effects of Sustained Moderate Flow at the STA-3/4 Periphyton-based Stormwater Treatment Area. Technical Publication WR-2017-003. South Florida Water Management District, West Palm Beach, FL.
- Zamorano, M. F. 2015. Effects of Pulse Flow Events on the STA-3/4 PSTA Cell's Phosphorus Treatment Performance. Technical Publication WR-2015-007. South Florida Water Management District, West Palm Beach, FL.
- Zamorano, M. F. 2017. Influence of Seepage on the STA-3/4 PSTA Cell's Treatment Performance. Technical Publication WR-2017-004. South Florida Water Management District, West Palm Beach, Florida.
- Zamorano, M. F., Grace, K., DeBusk, T., Piccone, T., Chimney, M., James, R. T., Zhao H., and Polatel, C. 2018. Appendix 5C-2: Investigation of Stormwater Treatment Area-3/4 Periphyton-based Stormwater Treatment Area Performance, Design, and Operational Factors. In: 2018 South Florida Environmental Report – Volume I, South Florida Water Management District, West Palm Beach, FL.
- Zamorano, M., Piccone, T. and Chimney, M.J. 2018. Effects of short-duration hydraulic pulses on the treatment performance of a periphyton-based treatment wetland. ecological engineering 111(1): 69-77.
- Zhao, H., T. Piccone, and M. Zamorano. 2015. STA-3/4 Periphyton-based Stormwater Treatment Area (PSTA) Cell Water and Total Phosphorus Budget Analyses. Technical Publication WR-2015-001. South Florida Water Management District, West Palm Beach, FL
Remote Environmental Sampling Technology: Evaluation of Sampling Methods for Total Phosphorus
Description/Objective
The objective of Restoration Strategies is to meet a stringent water quality based effluent limit (WQBEL) for phosphorus (P). To assure that the WQBEL is reached, sampling and monitoring techniques must accurately measure total P (TP) concentrations The goal of this study is to determine the accuracy of the sampling and monitoring being used and to evaluate factors that may influence results.
More information can be found here:
Detailed Study Plan
Activities Completed and Current Status
The study was completed in 2017.
Various sampling methods were evaluated. Cameras were used to observe physical and biological disturbances that could affect sample quality. Methods were compared based on analytical results and sampling efficiency. Sample sets using different methods, including, Grab sampling, flow-proportional composite autosamplers (ACF) and discrete autosamplers based on time (ADT), were collected. These sets were compared with measurements from a remote phosphorus analyzer (RPA) deployed within the Stormwater Treatment Areas (STAs). Additionally, water quality sondes were deployed to measure conductivity, pH and turbidity.
Results
Data comparisons suggest that Grab and ADT collection methods are more reliable than ACF methods. Under some conditions, the ACF method may be biased and not meet the completeness (percent of acceptable samples collected based on planned number of samples to be collected) target of 90%. Completeness estimates differ, depending on whether they are based on time coverage and/or flow representation. Reverse, low or poorly defined flows interfere with ACF sampling and can lead to non-representative samples, particularly at sites with small water level differences from up to downstream. Data from the RPA method indicated a mid-day peak in TP concentrations.
Infrastructure and levees can function as habitat for wildlife and could be potential sources of TP. Some animals such as anhingas and turtles were observed interfering directly with sampling systems. Masses of submerged aquatic vegetation were also observed to accumulate often at the sample intake screens, but the influence of these events on TP results was not clear.
It is recommended that flow proportionality of autosamplers and comparison of ACF versus ADT at multiple locations be further investigated. The use of ACF method at structures with small water level differences from up to downstream should be discouraged. Evaluating the completeness of collection should be based on the amount of flow represented, rather than time. Also, methods for limiting wildlife impacts on surface water sampling should be studied further.
Publications
Investigation of Rooted Floating Aquatic Vegetation in Stormwater Treatment Areas
Description/Objective
Rooted floating aquatic vegetation (rFAV) can make up a substantial amount of the vegetation in Stormwater Treatment Areas (STAs). They could be a valuable method of removing phosphorus (P) as they can grow in deep areas where emergent (EAV) and submergent aquatic vegetation (SAV) cannot. This study was to determine if rFAV enhance low-level P removal in back-end SAV communities of STAs.
The study included two phases:
Phase I of this study Evaluated P in the water column of rFAV and SAV patches to determine if differences exist.
Phase II of this study determined if Phase I findings were consistent among the STAs and then examined the mechanisms that account for the differences between patches.
More information can be found here:
Detailed Study Plan
Activities Completed and Status
The study was completed in 2018.
The spatial variability of water quality within rFAV and SAV patches and differences between rFAV and SAV patches over time were examined to determine factors that could explain patch differences [1, 2, 3]. Expanded sampling of additional patches verified findings from primary patches. This included measurements of water column pH, temperature, dissolved oxygen and conductivity. Soil physical properties and nutrients including porewater also were measured within each patch.
Results
Water column P concentrations were different for two of the three patches of rFAV plant species compared to nearby SAV patches [1, 2, 3]. Water column P concentrations in white water lily and American lotus patches were higher than in the nearby SAV patch, while water column P concentrations in a spatterdock patch were not significantly different from the nearby SAV patch. Soils in white water lily patches were lower in bulk density, higher in organic content and lower in calcium content compared to its paired SAV patch. This low bulk density soil may be prone to resuspension and could contribute to the higher particulate P concentrations in the water column. Dissolved oxygen and pH indicated greater aquatic metabolism in the SAV patch relative to the rFAV patch. Greater aquatic metabolism resulted from increased photosynthesis in the water column, which led to higher pH during the daylight hours. This higher pH may enhance co-precipitation of P with calcium resulting in more P removal. The soil from American lotus patches has a higher organic content than SAV patches but were similar otherwise.
Reports and Publications
- Powers, M. 2018. Role of Rooted Floating Aquatic Vegetation, in 2018 South Florida Environmental Report – Volume I Chapter 5C: Restoration Strategies Science Plan Implementation (D. Ivanov, T. Piccone, T. James, and J. McBryan Eds.). South Florida Water Management District, West Palm Beach, FL.
- Powers, M. 2019. Evaluation of the Role of Rooted Floating Aquatic Vegetation in STAs, in 2019South Florida Environmental Report – Volume I Chapter 5C: Restoration Strategies Science Plan Implementation (T. James, D. Ivanoff, T. Piccone, and J. King Eds.). South Florida Water Management District, West Palm Beach, FL.
- DBE Environmental. 2018. Enhancing Vegetation-based Treatment in the STAs: Evaluations of Rooted Floating Aquatic Vegetation Deliverable #5b: Draft Technical Publication. Submitted to South Florida Water Management District; and Everglades Agricultural Area Environmental Protection; West Palm Beach Florida.
Evaluation of Inundation Depth and Duration Threshold for Cattail Sustainability
 Cattail (Typha spp.) communities are an important component of Stormwater Treatment Areas (STAs). They remove particulate phosphorus (PP) by reducing water turbulence allowing the particles to settle. PP in moving water may be removed through colliding with and adhering to plant leaves. Soluble P is removed by algae attached to cattail leaves. Algae and PP can settle onto soils where they can be buried or degraded, releasing soluble forms of P. The soluble P may be taken up by roots and stored in rhizomes, roots, shoots or leaves of the plant.
Areas of cattail growing throughout STAs reduce water flow velocity and block the effects of winds from major storm events, thereby supporting aquatic vegetation.
Cattail are hardy plants, but they can decline or die if water levels are too deep for a long period.
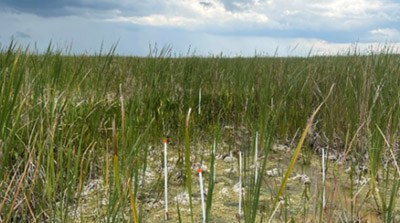
Phase I of this study examined water levels and cattail stress within STA-3/4 Cell 2A through seasonal monitoring of water depths, cattail density, leaf elongation rate (LER), photosynthesis, and plant biomass with varying water depths [1,2]. Declines in any of these measures are an indicator of poorer cattail health.
Phase II of this study evaluated water depth and cattail stress in more controlled environments: half-acre test cells in which water levels were maintained at constant depths between 40 and 124 cm [3]. This part of the study provided evidence of the length of time that suboptimal (deep) water depths can be maintained without cattail communities collapsing. This information is useful for operational guidance of the STAs.
More information can be found here:
Detailed Study Plan
Activities Completed and Results
Phase I field monitoring was carried out from Water Year (WY: May through April) 2016 to WY2018 [1,2]. Cattail densities during the wet seasons were lower in the inflow region of STA-3/4 Cell 2A, where water levels are deeper compared to the outflow region of the cell. Cattail densities declined in the inflow region where water depths were greater than three feet (91 cm) for long periods of time. Leaf elongation rates were consistently higher in the inflow region. Photosynthetic rates and total live biomass were not different between the inflow and outflow regions. Throughout the STA cell, cattail biomass declined over time. The belowground biomass to leaf ratio declined over time in the inflow region indicating that the cattail population was stressed more in this region.
Phase II water depth experiments were carried out in the STA-1W Northern Test Cells (Figure 2 [3]). The Test Cells were refurbished in 2016 to improve soil and water control. Cattail seeds and seedling plants were added to the tests cells from May to June 2018. The plants fully matured by spring of 2019. The water depth experiments began July 1, 2019. One of five depth treatments was randomly assigned to three of the 15 cells: 1) 1.3 feet (40 cm, control), 2) 2.0 feet (61 cm, shallow), 3) 2.75 feet (84 cm, moderate), 4) 3.4 feet (104 cm, deep), and 5) 4.1 feet (124 cm, extremely deep]. Cattail density, water quality, LER, transpiration, water use efficiency and photosynthesis were measured monthly from July 2019 to late April 2020.
Final cattail biomass sampling and processing were completed late July 2020 [3].
All outflow P species except dissolved organic P (DOP) were significantly less than inflow P species for all treatments except the control cells. This exception is attributed to a lower amount of submerged aquatic vegetation and attached algae in the control cells due to the lower water levels. These lower water levels resulted in faster turnover of the water, compared to other treatments, reducing the ability of control cells to retain P.
Adult cattail densities declined over the 10-month period in all treatments, however, the densities were not significantly different from the control. Juvenile cattail density were significantly lower in the deep and extremely deep treatments (1.2 and 0.6 shoots/m2) compared to the control (3.2 shoots/m2) for the ten-month period, suggesting that long periods of deep water lead to reduced cattail density over time.
Cattails respond to increased water levels by increasing leaf length, which allows plants to maintain photosynthesis and activities related to gas exchange. These longer leaves explain the lack of significant differences among the treatments for photosynthetic rates, transpiration and water use efficiency values. Photosynthetic rates were significantly lower only for the extremely deep treatment compared to the control. While LER is important for the plant to survive increases in water level, excessive LER can lead to cattail collapse (see below). LER was significantly higher in cattail plants from the deeper treatments, with the higher LER measured during the active growing period (July-October).
Trade-off between density and weight in the cattail populations among the different water level treatments could in part explain the lack of significance of biomass change due to water depths in this study. However, there was a reduction in vegetative reproduction, as the juvenile density significantly decreased with increasing water depths.
The most significant difference among the treatments was noted at the end of the ten-month experiment. The faster LER in the deeper treatments resulted in less structural support of the leaves, causing substantial lodging (collapse) when water levels were lowered at the end of the study (Figure 2). Overall, cattail demonstrated tolerance at constant water depths ≥ 84 cm for ten months, however, cattail density (i.e., fewer juveniles and adults) and their ability to reproduce were significantly affected in the deep (104 cm) and extremely deep (124 cm) water level treatments and should be considered in the overall management of these systems.
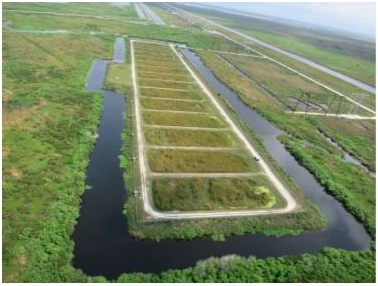
Figure 1. STA-1W North Test Cells study location.
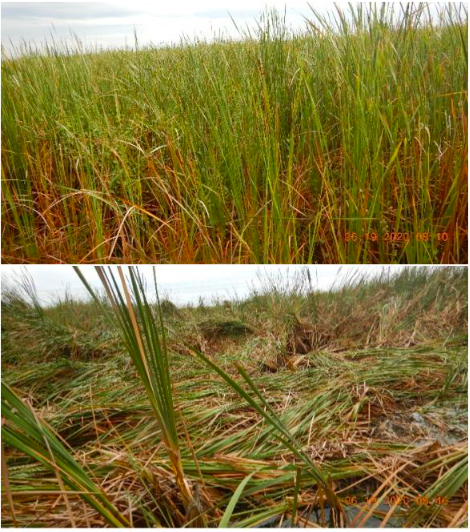
Figure 2. Post study photos from test cells after water was drained to harvest aboveground and belowground biomass. The top photo is the control (40-cm) and the bottom is the extremely deep treatment (124-cm).
- Diaz, O., Appendix 5C-5: Evaluation of Inundation Depth and Duration Threshold for Cattail Sustainability., in South Florida Environmental Report – Volume I. 2018: South Florida Water Management District, West Palm Beach, FL.
- Diaz, O. and K. Vaughan., Appendix 5C-2. Evaluation of Inundation Depth and Duration Threshold for Cattail Sustainability: In-Situ Study., in 2019 South Florida Environmental Report – Volume I. 2019: South Florida Water Management District, West Palm Beach, FL.
- Diaz, O., Appendix 5C-1: Evaluation of Inundation Depth and Duration Threshold for Typha domingensis (Cattail) Sustainability: Test Cell Study., In 2022 South Florida Environmental Report – Volume I. 2022: South Florida Water Management District, West Palm Beach, FL.
Stormwater Treatment Area Water and Phosphorus Budget Improvements
Description/Objective
 Water and phosphorus (P) budgets are important tools that can be used to understand the treatment performance of Stormwater Treatment Areas (STA). Accurate water budgets are critical to develop accurate P budgets. The objective of this study is to improve the annual water and P budgets for selected STA treatment cells or flow-ways.
The study includes two phases:
- Phase I – Evaluate the annual water budgets for STA-3/4 Cells 3A/3B; used as a test case. Evaluate sources of error and improve the annual water budgets [1].
- Phase II – Improve period of record (POR) flow data and water and P budgets for all cells of STA-3/4 [2, 4] and STA-2 Flow-ways 1-3 [3, 4].
More information can be found here:
Detailed Study Plan
Activities Completed and Current Status
The study was completed in 2020.
Phase I evaluation was completed in 2014 [1].
Phase II was completed in 2020 [2, 3, 4].
Period of record flow data for all cells of STA-3/4 [2] and STA-2 Flow-ways 1 to 3 [3] have been improved. Work to improve the South Florida Water Management District's Water Budget Tool was completed. Improved POR water and P budgets for STA-2 Flow-ways 1 to 3 were completed in 2017 [3] and all cells of STA-3/4 [2] were completed in 2018. Annual and long-term average annual flow-way and treatment cell Total P (TP) flow-weighted mean concentration (FWMC) in outflows, TP load retention percentage, and TP FWMC reduction percentage were calculated. The effect of annual hydraulic loading rate, annual phosphorus loading rate, annual average hydraulic residence time, inflow TP FWMC, and annual average water depth on annual outflow TP FWMC were evaluated.
Results
For STA-3/4 Cells 3A/3B, small differences in water levels across large culverts at mid-levees were the main source of error in annual cell-by-cell water budgets [2]. The budgets were greatly improved by updating flows between the upper and lower portions of the flow-way. Annual errors for the water budgets were reduced to 8% or less. Rainfall, evapotranspiration, change in storage and seepage were minor contributors to these cells' annual water budgets and the current methods for estimating these components were found to be acceptable for Phase II.
Annual water and P budgets were developed for STA-2 Flow-ways 1 to 3 for Water Year 2002 (WY2002) to WY2016, and for STA-3/4 Cells 1A, 1B, 2A, 2B for WY2006 to WY2017 and for STA-3/4 Cells 3A and 3B for WY2009 to WY2017 [4]. Improved POR flow and stage data for STA-2 and STA-3/4 inflow and outflow structures were used in the analyses. Rainfall, evapotranspiration, and seepage estimates were included. A new calibrated seepage coefficient (1.1 cfs/ft/mi) was used for the water budgets. These efforts resulted in more reliable water and P budgets and other performance estimates including annual and long-term average annual hydraulic retention times, hydraulic loading rates, P loading rates, and P reduction efficiency. For the six flow-ways studied, a higher frequency of low-level outflow TP annual FWMC was achieved when the annual hydraulic residence time was longer than 14 days, annual hydraulic loading rate was less than or equal to 3.5 cm day−1, the annual water depth was shallower than or equal to 0.65 meter, the annual P loading rate was smaller than or equal to 1.2 g m2 yr−1, or the annual inflow TP FWMC was less than or equal to 100 μg L−1. This study demonstrated that TP settling rate alone is not adequate to evaluate STA treatment performance especially when hydraulic loading rates differ. This study also helped improve understanding of the factors that affect the treatment performance of large-scale constructed wetland flow-ways which consistently retained TP and reduced TP concentrations over a long-term operational period.
- Polatel, C., et al., 2014, Stormwater Treatment Area Water and Phosphorus Budget Improvements – Phase I: STA-3/4 Flow-ways 3A and 3B Water Budgets. Technical Publication WR-2014-004. South Florida Water Management District, West Palm Beach, FL.
- Zhao, H. and T. Piccone, 2019, Appendix 5C-5 Summary Report for Water and Total Phosphorus Budget and Performance Analysis for Stormwater Treatment Area 3/4. In: 2019 South Florida Environmental Report – Volume I. South Florida Water Management District, West Palm Beach, FL.
- Zhao, H. and T. Piccone, 2018, Appendix 5C-6 Summary Report for Stormwater Treatment Area 2 Flow-ways 1, 2, and 3 Water and Total Phosphorus Budget Analyses. In: 2018 South Florida Environmental Report – Volume I. South Florida Water Management District, West Palm Beach, FL.
- Zhao, H. and T. Piccone, Large Scale Constructed Wetlands for Phosphorus Removal, An Effective Nonpoint Source Pollution Treatment Technology. 145:. Ecological Engineering, 145.
Evaluation of Factors Contributing to the Formation of Floating Tussocks in the Stormwater Treatment Areas
Description/Objective
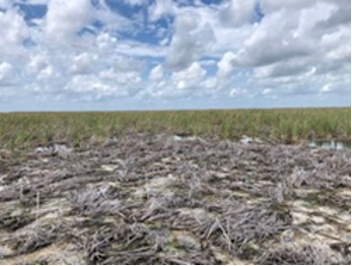
Floating tussocks (floating wetlands) in Stormwater Treatment Areas (STAs) can uproot Emergent Aquatic Vegetation (EAV), shade out Submerged Aquatic Vegetation (SAV), increase turbidity, block gates and other water control structures, and create short circuits. All these actions can reduce STA treatment performance. This study evaluates factors that cause the formation of floating wetland areas in STAs and methods to determine current coverage of these floating areas.
The Study was completed in two phases:
Phase I of this study included four tasks:
- A literature review of floating wetland types, buoyancy mechanisms, formation, and controls
- A nomenclature of floating wetlands based on floating substrate, dominant plant community, size, and location
- Classification maps of floating wetland communities in STA-1W Cell 2A and STA-2 Cell 7 using Unmanned Aircraft Systems (UAS)
- Thermographic (infra-red) imagery to detect floating vs. emergent vegetation
Phase II of this study included three tasks:
- Evaluation of relationships between occurrence and distribution of floating wetlands and environmental and management factors that could trigger floating wetland formation
- A refined UAS methodology and workflow, used for surveys of all STA EAV cells
- A Typha Wetland Buoyancy Model to evaluate root holding capacity vs increasing buoyancy as Typha are exposed to deeper water
More information can be found here:
Detailed Study Plan
Activities Completed and Status
All tasks are completed. Deliverables from Phase II: 2. UAS Assessment of STA Cells [5] and 3. Typha (cattail) Wetland Buoyancy Model [6] are in review.
Results
A review of the literature found a consistent terminology to describe the various types of floating vegetation does not exist. A nomenclature was developed, based on the presence or absence of floating substrate, horizontal connectivity, and dominant vegetation, to define floating emergent plant communities in the STAs [1].
An Unmanned Aircraft System (UAS) carrying multispectral camera was used to survey two EAV cells for floating wetland communities. Typha floating wetlands were found that were not observed in satellite imagery [2]. Floating wetlands were identified based on observed flattened vegetation, presence of fern seedlings, and nearby open seams. Thermographic (infra-red) imagery was attempted to improve the identification of these floating wetlands, but was difficult to interpret. However, midday thermographic images were useful and could complement associated images.
Historical data from the STAs were analyzed to identify significant predictors of floating wetland communities across EAV cells [3]. Results suggested a higher potential for floating vegetation occurs in and STAs: 1) if land had been farmed a short time before the STA was constructed, 2) if TP in the soil was low and 3) if water levels were exceedingly high (greater than 90% of the daily observed water levels). A buoyancy model based on this literature review and field measurements was developed in Phase II.
A refined method was developed to collect and process UAS data based on the previous survey [4]. Photos were collected using a Sentera AGX710 multispectral camera housed on a DJI Matrice 200 drone (Figure 1). This refinement of photo collection used a grid point sampling pattern at low altitudes (50-100 feet), improved accuracy during photo capture and reduced the amount of computer time needed to correct the photos. Photos could then be classified manually to determine vegetative community and its condition. This alternative approach was used to survey most of the STA cells with EAV, locating floating aquatic plants, floating organic vegetation and Typha lodging in a number of regions [5].
A buoyancy model was then developed to evaluate the effect of water levels and various plant and soil conditions on the probability that floating tussocks will occur [6]. This report is currently under review and completes this study.[SS1]
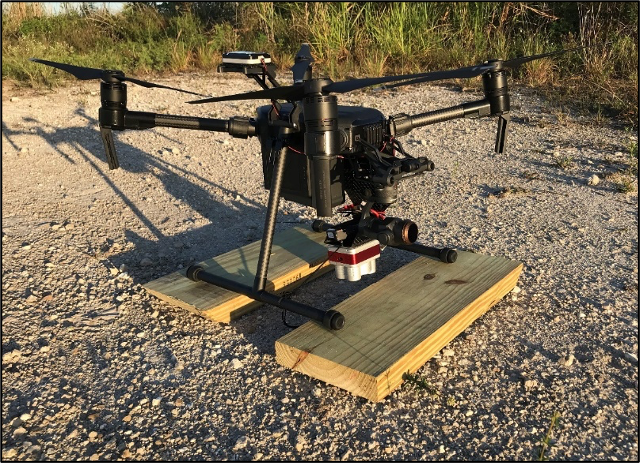
Figure 1. Photo of a DJI Matrice 200 drone used in the mapping effort of the Tussock Study.
- Clark, M. 2019. Proposed Floating Wetland Nomenclature. Phase I. Task 2b. Submitted by Soil and Water Science Department, University of Florida, Gainesville, FL, to South Florida Water Management District, West Palm Beach, FL.
- Clark, M., and K. Glodzic. 2019. Phase I. Assessment of Floating Wetlands Coverage in STA EAV Cells. Task 3a Submitted by Soil and Water Science Department, University of Florida, Gainesville FL, to South Florida Water Management District, West Palm Beach, FL.
- Clark, M., and K. Glodzic. 2020. Data Mining and Statistical Analysis of Environmental Factors Related to Floating Tussock Formation. Phase II Task 1 Submitted by Soil and Water Science Department, University of Florida, Gainesville FL, to South Florida Water Management District, West Palm Beach, FL.
- Clark, M. and K. Glodzic. 2021. Evaluation of Factors Contributing to the Formation of Floating Tussocks in the STAs: Phase II Task 2a. Refined UAS Methodology and Workflow. Submitted by the Soil and Water Science Department, University of Florida, Gainesville FL to South Florida Water Management District, West Palm Beach, FL
- Clark, M., L. Griffiths, and K. Glodzik. 2022. Evaluation of Factors Contributing to the Formation of Floating Tussocks in the STAs: Phase II Task 2b: UAS Assessment of Floating Wetland Formation in STA EAV Cells Submitted by the Soil and Water Science Department, University of Florida, Gainesville FL to South Florida Water Management District, West Palm Beach, FL.
- Clark, M. 2022. Evaluation of Factors Contributing to the Formation of Floating Tussocks in the STAs: Phase II Task 3: Typha Wetland Buoyancy Model. Submitted by the Soil and Water Science Department, University of Florida, Gainesville FL to South Florida Water Management District, West Palm Beach, FL.
Investigation of the Effects of Abundant Faunal Species on Phosphorus Cycling in the Everglades Stormwater Treatment Areas
Description/Objective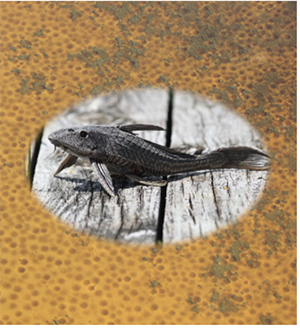
Aquatic fauna, fish and large invertebrates such as crayfish, may significantly affect phosphorus (P) cycling within Stormwater Treatment Areas (STAs). This study evaluates the potential of aquatic fauna to affect Total P reduction in STA surface waters. The study may provide management recommendations for aquatic fauna to improve STA treatment performance.
The study includes five tasks:
- Estimate biomass of fish and aquatic invertebrates (STA-2) and aquatic faunal community composition (STA-1E, STA-1W and STA-3/4); analyzed P and nitrogen (N) storage in tissues of individuals of abundant fishes (STA-2) [1,2]. This task is complete.
- Estimate P excretion rates of selected abundant fishes to estimate contribution to STA P budgets [3]. Evaluated benthic (sediment foraging) fish to determine their contribution to water column nutrients through bioturbation (i.e., activities that resuspend soils, including particle disturbance, ingestion and defecation). This task is complete.
- Use biomass and excretion estimates to calculate areal (per ha) P excretion by the entire aquatic faunal population in STA-2 (i.e., rates of P released to the water column via excretion, μg P/ha/ h). This task is ongoing.
- Calibrate electrofishing through collection of non-native fish biomass by electrofishing compared to collection of these fish with block nets. Fieldwork is complete, analyses are ongoing.
- Determine the effect of herbivory of SAV by large-bodied fishes using a 3-part enclosure and exclosure experiment focused primarily on the effects of the fish community as a whole and secondarily on the influence of invasive tilapia specifically. Fieldwork is complete, analyses are ongoing.
More information can be found here:
Work Plan
Activities Completed and Current Status
The STAs support a high biomass of fish and macroinvertebrates. By comparison, the biomass per unit area was approximately 2-15 times higher than in other Everglades regions [1,2].
Ten of the most abundant fish species in STA-2 stored one metric ton of P and 3.7 metric tons of N within their body tissues, and excreted > 0.626 kg of P per hour and > 3.897 kg of N per hour [3,6]. Moreover, bioturbation by large fish was found to quickly and substantially increases the TP content of enclosures by 2 to 3 times [5,7]. These calculations demonstrate that storage, excretion, and bioturbation by fishes are important processes of P and N cycles within STA habitats [4]. Data from a recently completed herbivory experiment is being used to evaluate the influence of fish grazing of aquatic plants and periphyton on P reduction. Data from the P Flux, P Dynamics, Biomarker, and Water and P Budget Studies will be used to refine the current estimates and incorporate the effects of fish into P budgets for the STAs.
-
Barton, M., et al., 2023: Evaluation of the Impact of Aquatic Animal Excretion on Nutrient Recycling and Retention in Stormwater Treatment Wetlands. Ecological Engineering 197, 107104.
-
Goeke, J., et al., in review: Linking fish bioturbation to function and behavior traits in a eutrophic wetland: a preliminary analysis of fish contributions to internal nutrient loading. Freshwater Biology
Quantifying Phosphorus Uptake and Release from Periphyton and Phytoplankton Communities
Description/Objective
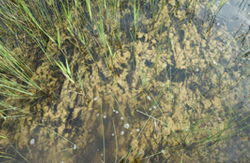 Periphyton (microbial communities of bacteria, algae, and fungi) grow on submerged aquatic plants surfaces, soils (epiphyton), or floating free in the water column (phytoplankton). These communities play an important role in phosphorus (P) cycling within the Everglades Stormwater Treatment Areas (STAs) through nutrient uptake, cellular growth, and senescence. The degree of periphyton nutrient cycling can affect P reduction in STAs, especially in outflow regions of the STA’s where P concentrations are very low (≤20 µg/L).
This study began as a substudy of the Phosphorus Flux study measuring enzyme activity in periphyton, floc, soils, and water column under various flow conditions and for EAV and SAV communities [3]. Phosphatase and N-acquisition enzymes were most active, while C-acquisition enzymes were least active. When dissolved organic P (DOP) in the surface water was above 10 μg/L, the phosphatase rates were low, suggesting P was not limiting. When DOP concentrations were <10 μg/L, phosphatase rates were greatly increased. The activity for N-acquisition enzyme was variable between EAV and SAV communities, but not along the flow-way. Using the ratio of N and P enzyme activity as surrogates for nutrient limiting conditions: both N- and P-limitation were found at the inflow and midflow sites. P-limitation only occurred at the outflows in all treatment cells. There were also indications that nutrient cycling differs between periphyton from the EAV and SAV communities under low-P conditions, suggesting there may be a complementary enzymatic response within a mixed marsh configuration that may enhance nutrient cycling.
This study quantifies periphyton processes of growth, senescence, and nutrient dynamics within the STAs. This information will indicate the significance of periphyton in P cycling and retention within the STAs. These results may provide important background information on periphyton P cycling processes that will improve our understanding of the factors that affect treatment performance at ultra-low TP concentrations.
There are three phases in this study:
Phase I was a literature review and analysis of periphyton-related research conducted in the STAs [1]. This phase is complete.
Phase II used lab and field experiments to evaluate periphyton processes and identify the analytical methodologies for use in the Phase III studies. This phase is complete.
Phase III uses advanced techniques to identify and evaluate periphyton community genetic structure and activity of nutrient cycling genes in the field. This phase is ongoing.
More information can be found here:
Project Summary
Activities Completed and Current Status
Phase I included two literature reviews that evaluated methodologies and results of periphyton studies with a focus on South Florida and the STAs [1, 2]. These reviews found that light intensity, temperature, and nutrient availability affect periphyton community structure. A few published rates on photosynthesis and growth, applicable to subtropical systems, were found. Approaches to measure periphyton community structure, productivity, decomposition, senescence, and nutrient uptake rates were reviewed. Information from these literature reviews will be applied to developing and implementing Phase III research studies. This phase is complete.
Phase II included bench top and field experiments. In the bench top study, the ability of periphyton to act upon bioavailable dissolved organic compounds in STA surface water were quantified in an incubation study completed in 2022. Metagenomics (which identifies the DNA of microbial species) of periphyton samples collected in the STAs were measured. The metagenomics results found numerous physiological processes (enzyme production, nutrient uptake, etc.) that could be tracked, potentially providing insight into the nutrient cycling potential of the epiphyte communities.
Phase III is a field-scale research study of periphyton metagenomics (DNA identification of periphyton microbial genes and species) and metatranscriptomics (quantifies active genes in microbes) to evaluate periphyton community responses to spatial and seasonal changes in water column nutrients and hydrology. This study began in December 2022, data analysis continues and is scheduled for completion in July, 2024.
Reports and Publications
- Laughinghouse, H. D., Berthold, D. E, Barbosa, M., and Lefler, F. W, May 2019, A Review on Tropical and Subtropical Periphyton and Phytoplankton Processes and Methods of Quantification, draft.
- DB Environmental, 2021. Microbial Processes Affecting Phosphorus Removal and Retention in the Everglades Stormwater Treatment Areas.
- Pietro, K. C., K. Inglett and A. Wright. 2023. Periphyton enzymatic activities in the water column along internal low-phosphorus nutrient gradients in the Everglades Stormwater Treatment Areas. Ecological Engineering 196: 107100.
P Removal Performance of Ecotopes in the STAs
 Wetland ecotopes are contiguous homogenous vegetation communities with similar physical and chemical environments. Water quality monitoring at the ecotope scale captures the effects of these smaller areas that are obscured at the larger landscape scale. These ecotopes include key ecological features present in the STAs that are not found in finer scale mesocosm research. Four different ecotopes in the outflow regions of STA-3/4 Central Flow-way were monitored for water quality, physico-chemical properties, and soil characteristics over two years. Ecotope types included a dominant Chara spp. ecotope, a dominant Typha domingensis ecotope, a codominant Najas guadalupensis and Chara spp. ecotope, and an open-water/bare ecotope.
More Information can be found here:
Detailed Study Plan
Results
The Chara ecotope had the lowest wet season mean TP in both years of the study [1,2]. Differences between the ecotopes mean wet season TP concentration were not large (typically less than 3 µg/L between all ecotopes), this could affect meeting WQBEL criteria for STAs with TP discharges near compliance limits. All ecotopes had wet season means below 13 µg/L except the mixed ecotope in Year 2. TP concentrations were higher in the dry season than the wet season. Because the dry season discharge is less, these higher dry season concentrations contribute less to the annual FWM concentration calculation than the wet season concentrations. Flow rate and water depth also affect wet season TP concentration. TP concentrations were reduced 5 µg/L as flow increased from 0 to 300 cfs, no further reduction was found above 300 cfs.
- Matt Powers, "P Removal Performance of Ecotopes in the Stas (Ecotope Study) " in Chapter 5c: Restoration Strategies Science Plan. South Florida Environmental Report, ed. R. Thomas James et al., vol. I, ed. SFWMD (West Palm Beach, FL: South Florida Water Managment District, 2024).
- M. Powers, "Removal Performance of Ecotopes in the Stas (Ecotope Study)," in 2025 South Florida Environmental Report Chapter 5c: Restoration Strategies Science Plan, ed. R. Thomas James et al., vol. I (West Palm Beach, FL: South Florida Water Management District, 2025).