Lake Okeechobee Watershed Construction Project (LOWCP)
Note: This page contains information published as part of the LOWPP 2020 Update.
For more recent information, please go to www.sfwmd.gov/wpps.
For the 2020 Update, the approach to evaluate the LOWCP was to identify the issues that are affecting the water quality and/or quantity in each of the subwatersheds and basins within the Lake Okeechobee Watershed, and then, determine if projects, also known as management measures (MM), are addressing (or not) those issues. To review the information compiled for each of the subwatersheds, please click below on the links provided.
The LOWCP update is complete and was submitted to FDEP to be incorporated into the Lake Okeechobee BMAP. Read more about this in the FDEP Submittal. FDEP’s Lake Okeechobee BMAP was adopted in February 2020 and can be found at https://floridadep.gov/bmaps. The LOWPP 2020 Update, which includes the updated LOWCP, is available on the 2020 SFER webpage (Volume I, Appendix 8A-1) at this link.
LAKE OKEECHOBEE WATERSHED
- LO Watershed
- Upper Kissimmee
- Lower Kissimmee
- Taylor Creek/Nubbin Slough
- East Lake Okeechobee
- South Lake Okeechobee
- West Lake Okeechobee
- Fisheating Creek
- Indian Prairie
- Lake Istokpoga
LAKE OKEECHOBEE WATERSHED
Subwatersheds: Upper Kissimmee, Lower Kissimmee, Taylor Creek/Nubbin Slough, East Lake Okeechobee, South Lake Okeechobee, West Lake Okeechobee, Fisheating Creek, Indian Prairie, Lake Istokpoga
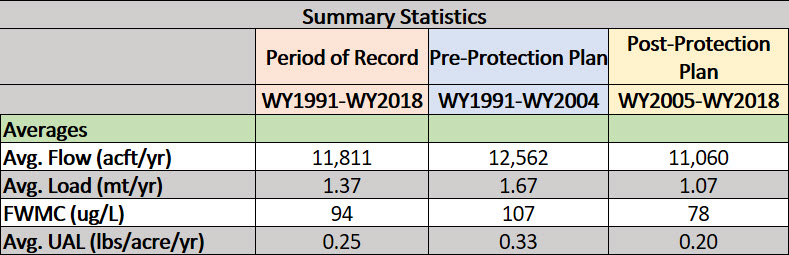
Period or Record (POR) Evaluated:
Overall: Water Year (WY) 1991 - WY2018
Pre LOWPP: WY1991 - WY2004
Post LOWPP: WY2005 - WY2018
PROJECTS IN THIS WATERSHED
 Purpose: Muck Scraping - Remove P-laden sediments from the marsh and expose the native lake bottom to improve the flora and fauna habitat.
Purpose: Tilling - Evaluate the effectiveness of tilling the surface organic layer into the underlying sand substrate as a mechanism for reducing the surficial total and extractable phosphorus (P) levels and reducing internal P loading.
Purpose: Reduce phosphorus loading from sediment beds in Lake Okeechobee.
 Purpose: Enhance reservoir phosphorus load reduction capacity and reduce phosphorus exports to Lake Okeechobee in the four priority basins.
Purpose: Evaluate the feasibility of EEPW as a long-term solution that, couple with projects, aims to reduce harmful discharges to the Caloosahatchee and the St. Lucie estuaries, or as an interim measure to provide additional storage while treatment and conveyance capacity are constructed south of Lake Okeechobee.
Purpose: The major goals of the Lake Okeechobee Watershed Restoration Project (LOWRP) - part of the Comprehensive Everglades Restoration Plan - are to improve the quantity, timing, and distribution of water entering Lake Okeechobee. LOWRP will improve management of lake water levels, reduce excessive releases to the St. Lucie and Caloosahatchee estuaries, and increase operational flexibility. These goals will be achieved through storage of water in surface reservoirs and underground in aquifer storage and recovery wells. Additional wetland areas also will be restored to enhance habitat utilization in the subwatersheds that are the focus of this project.
UPPER KISSIMMEE BASINS
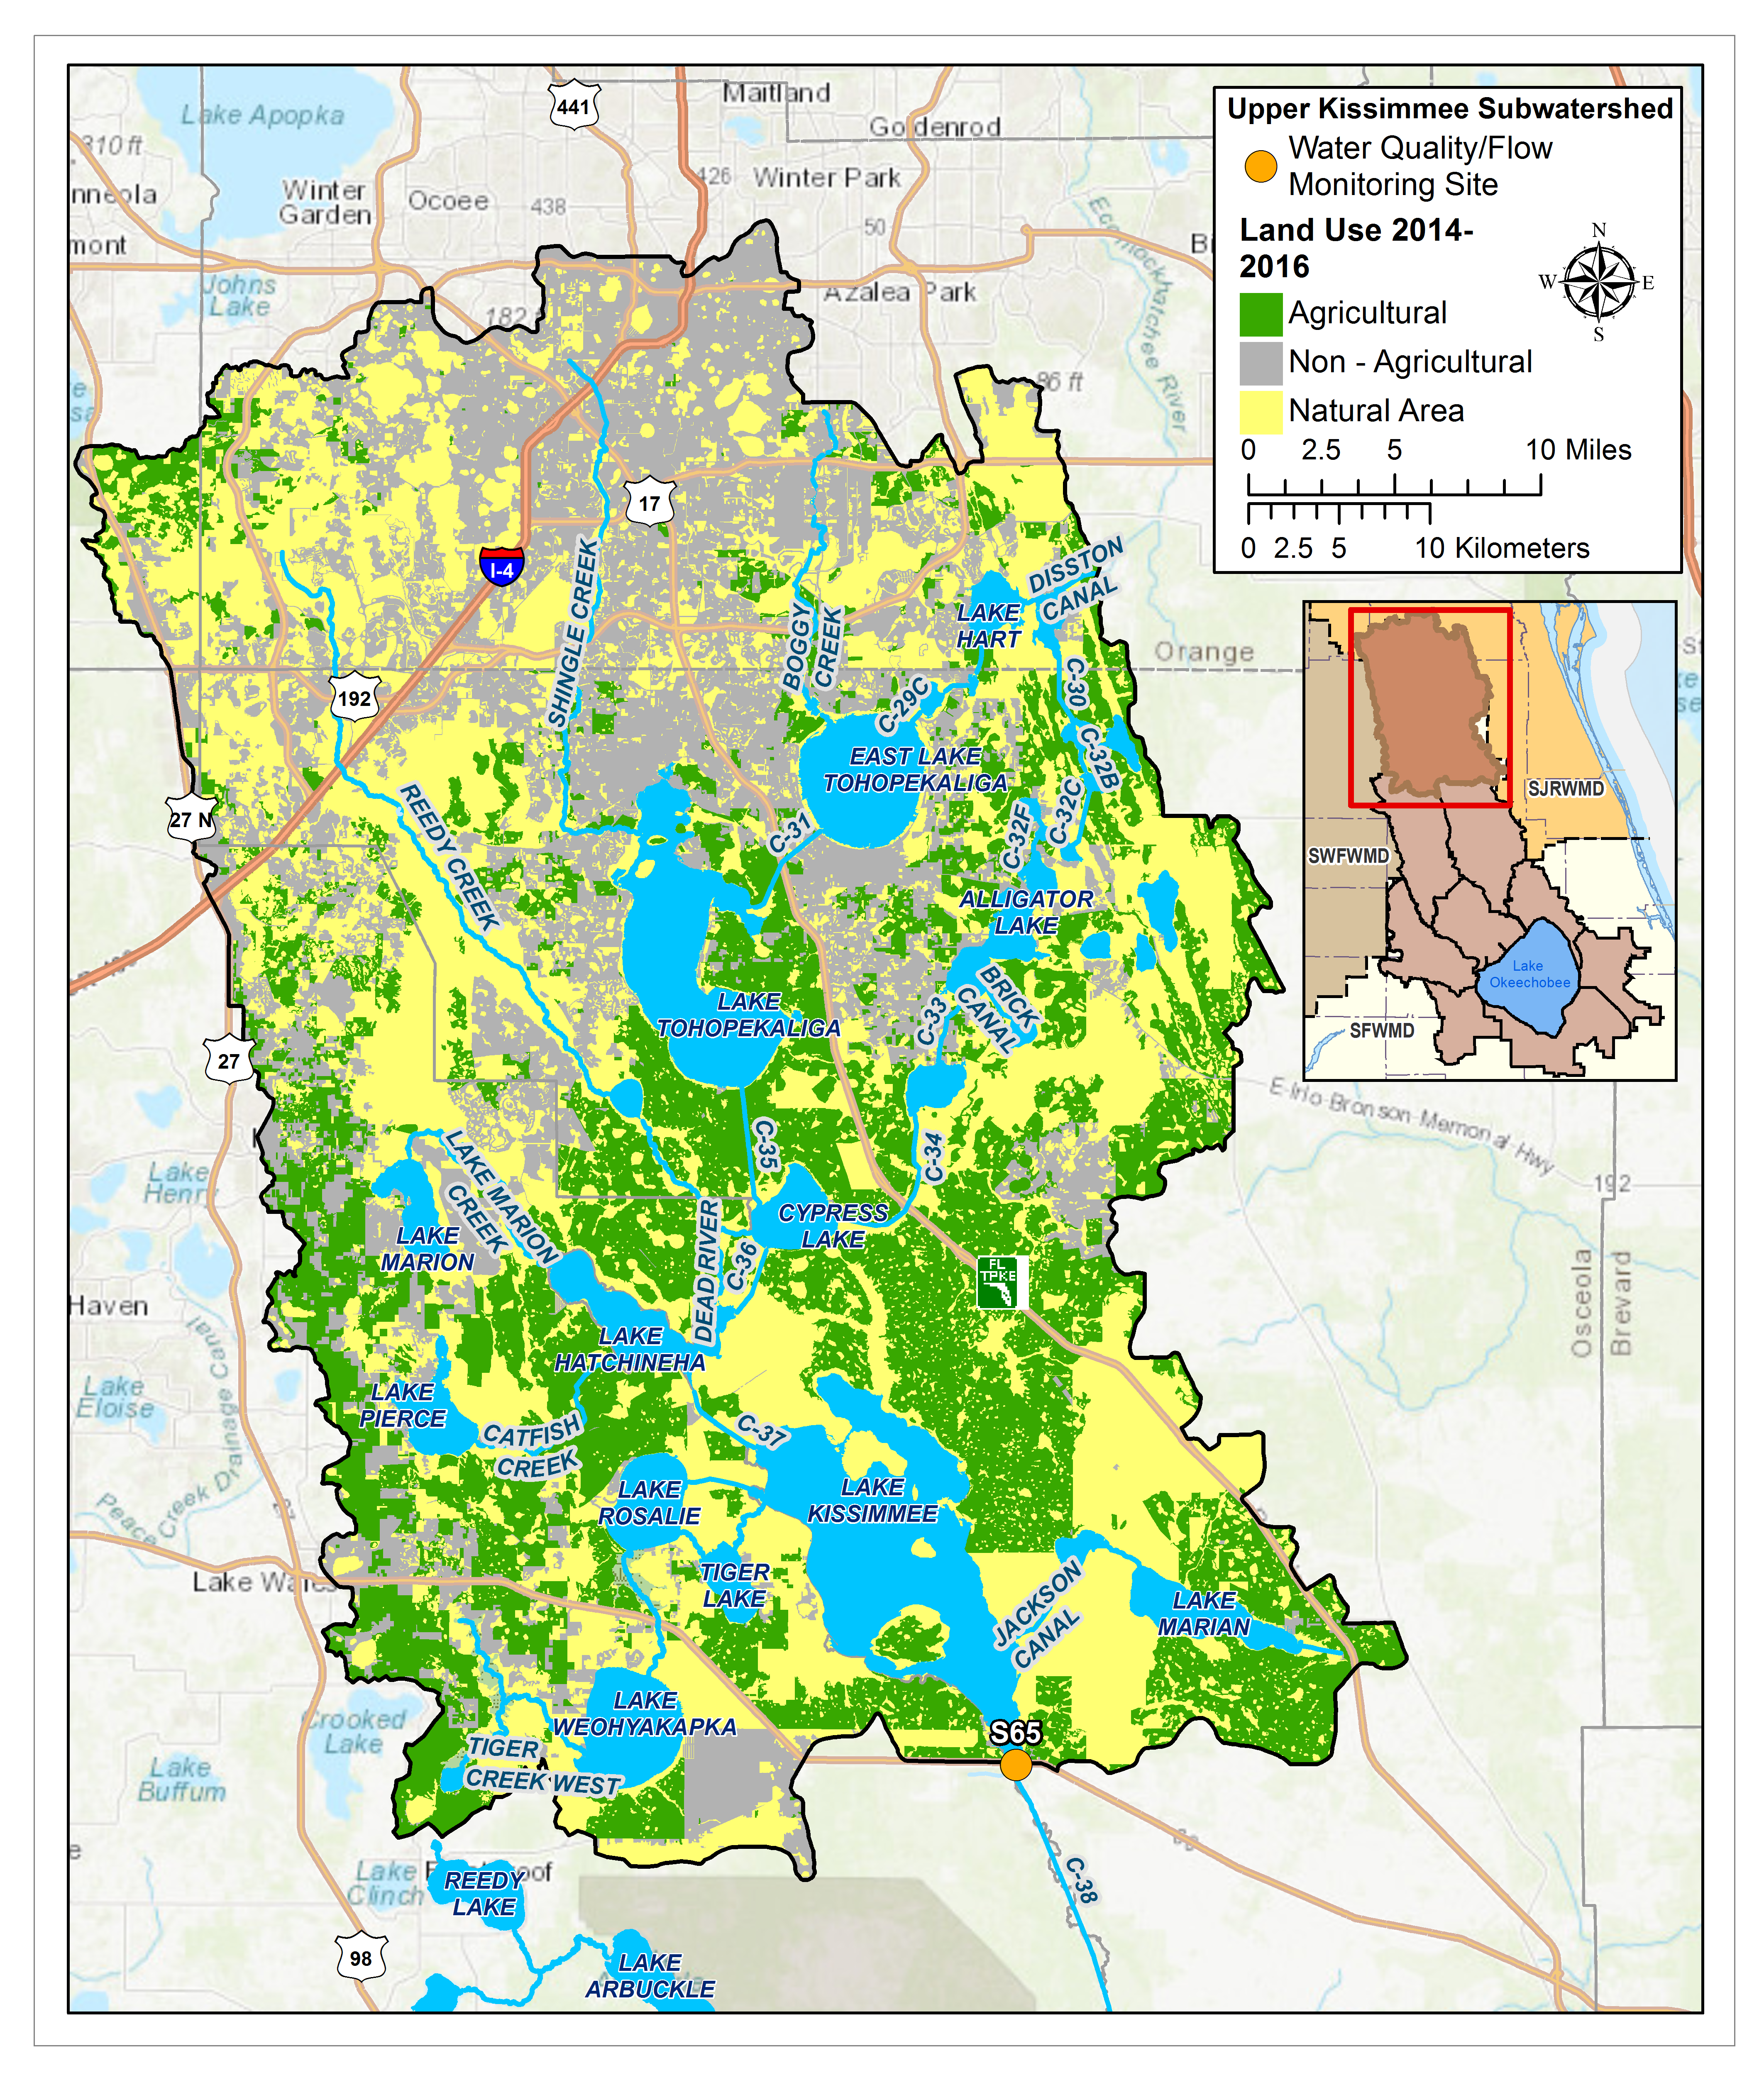
UPPER KISSIMMEE SUBWATERSHED
Total Area: 1,028,421ac
% Area of Lake Okeechobee Watershed: 29.8%
% TP Load of Lake Okeechobee Watershed: 17.3%
Monitoring Locations: S65
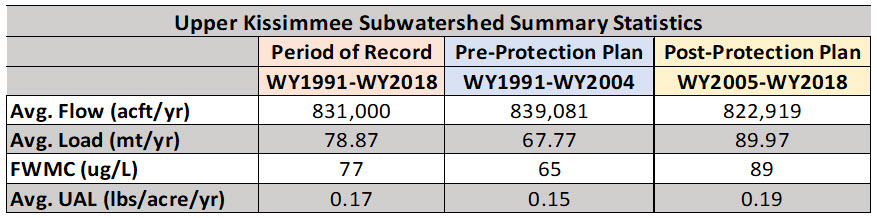
Flow Issues: No
- The Flows appeared to stay consistent as there was no significant difference between the pre and post protection-plan periods and there were no significant trends for flow within any of the periods. While there was a large change in sen slope between the pre and post-protection plan period for flow, it was not statistically significant and seems small in magnitude (1142.84 ac-ft/yr) when compared to the flow of 835,000 ac-ft/yr.
- The Headwaters Revitalization regulation schedule for lakes Kissimmee, Cypress and Hatchineha is planned to be implemented in late 2020. It is expected that changes to the operations at S-65 based on the revised schedule will reduce extremely high discharges and extended periods of zero flow. This is likely to improve water quality.
Water Quality Issues: Maybe
- There was a statistically significant increasing trend in total phosphorus (TP) flow-weighted mean concentrations (FWMC) during the pre-protection plan period but not in the post-protection plan period. The average TP FWMC in the post-protection plan period is relatively low 89 μg/L, as is the unit area load at 0.19 lbs/acre/yr. The large area is influential to its load contribution.
- The group recommends analyzing water quality data collected within the sub-watershed to determine if there are tributaries that have very high TP concentrations. It is also recommended to investigate TP discharged from a large parcel of land SFWMD recently acquired that is immediately upstream of the S-65 structure to see if it a significant source of TP load.
- Lake Kissimmee is immediately upstream of the discharge monitoring location where data are collected for load calculations and may influence results. May need to verify that data represents basin runoff.
>>Additional Technical Information
PROJECTS LOCATED IN THIS SUBWATERSHED
 Purpose: Provide shallow storage, retention and detention to enhance Lake Okeechobee and estuary health by reducing discharge volumes, reducing nutrient loading to downstream receiving waters, and expanding groundwater recharge opportunities.
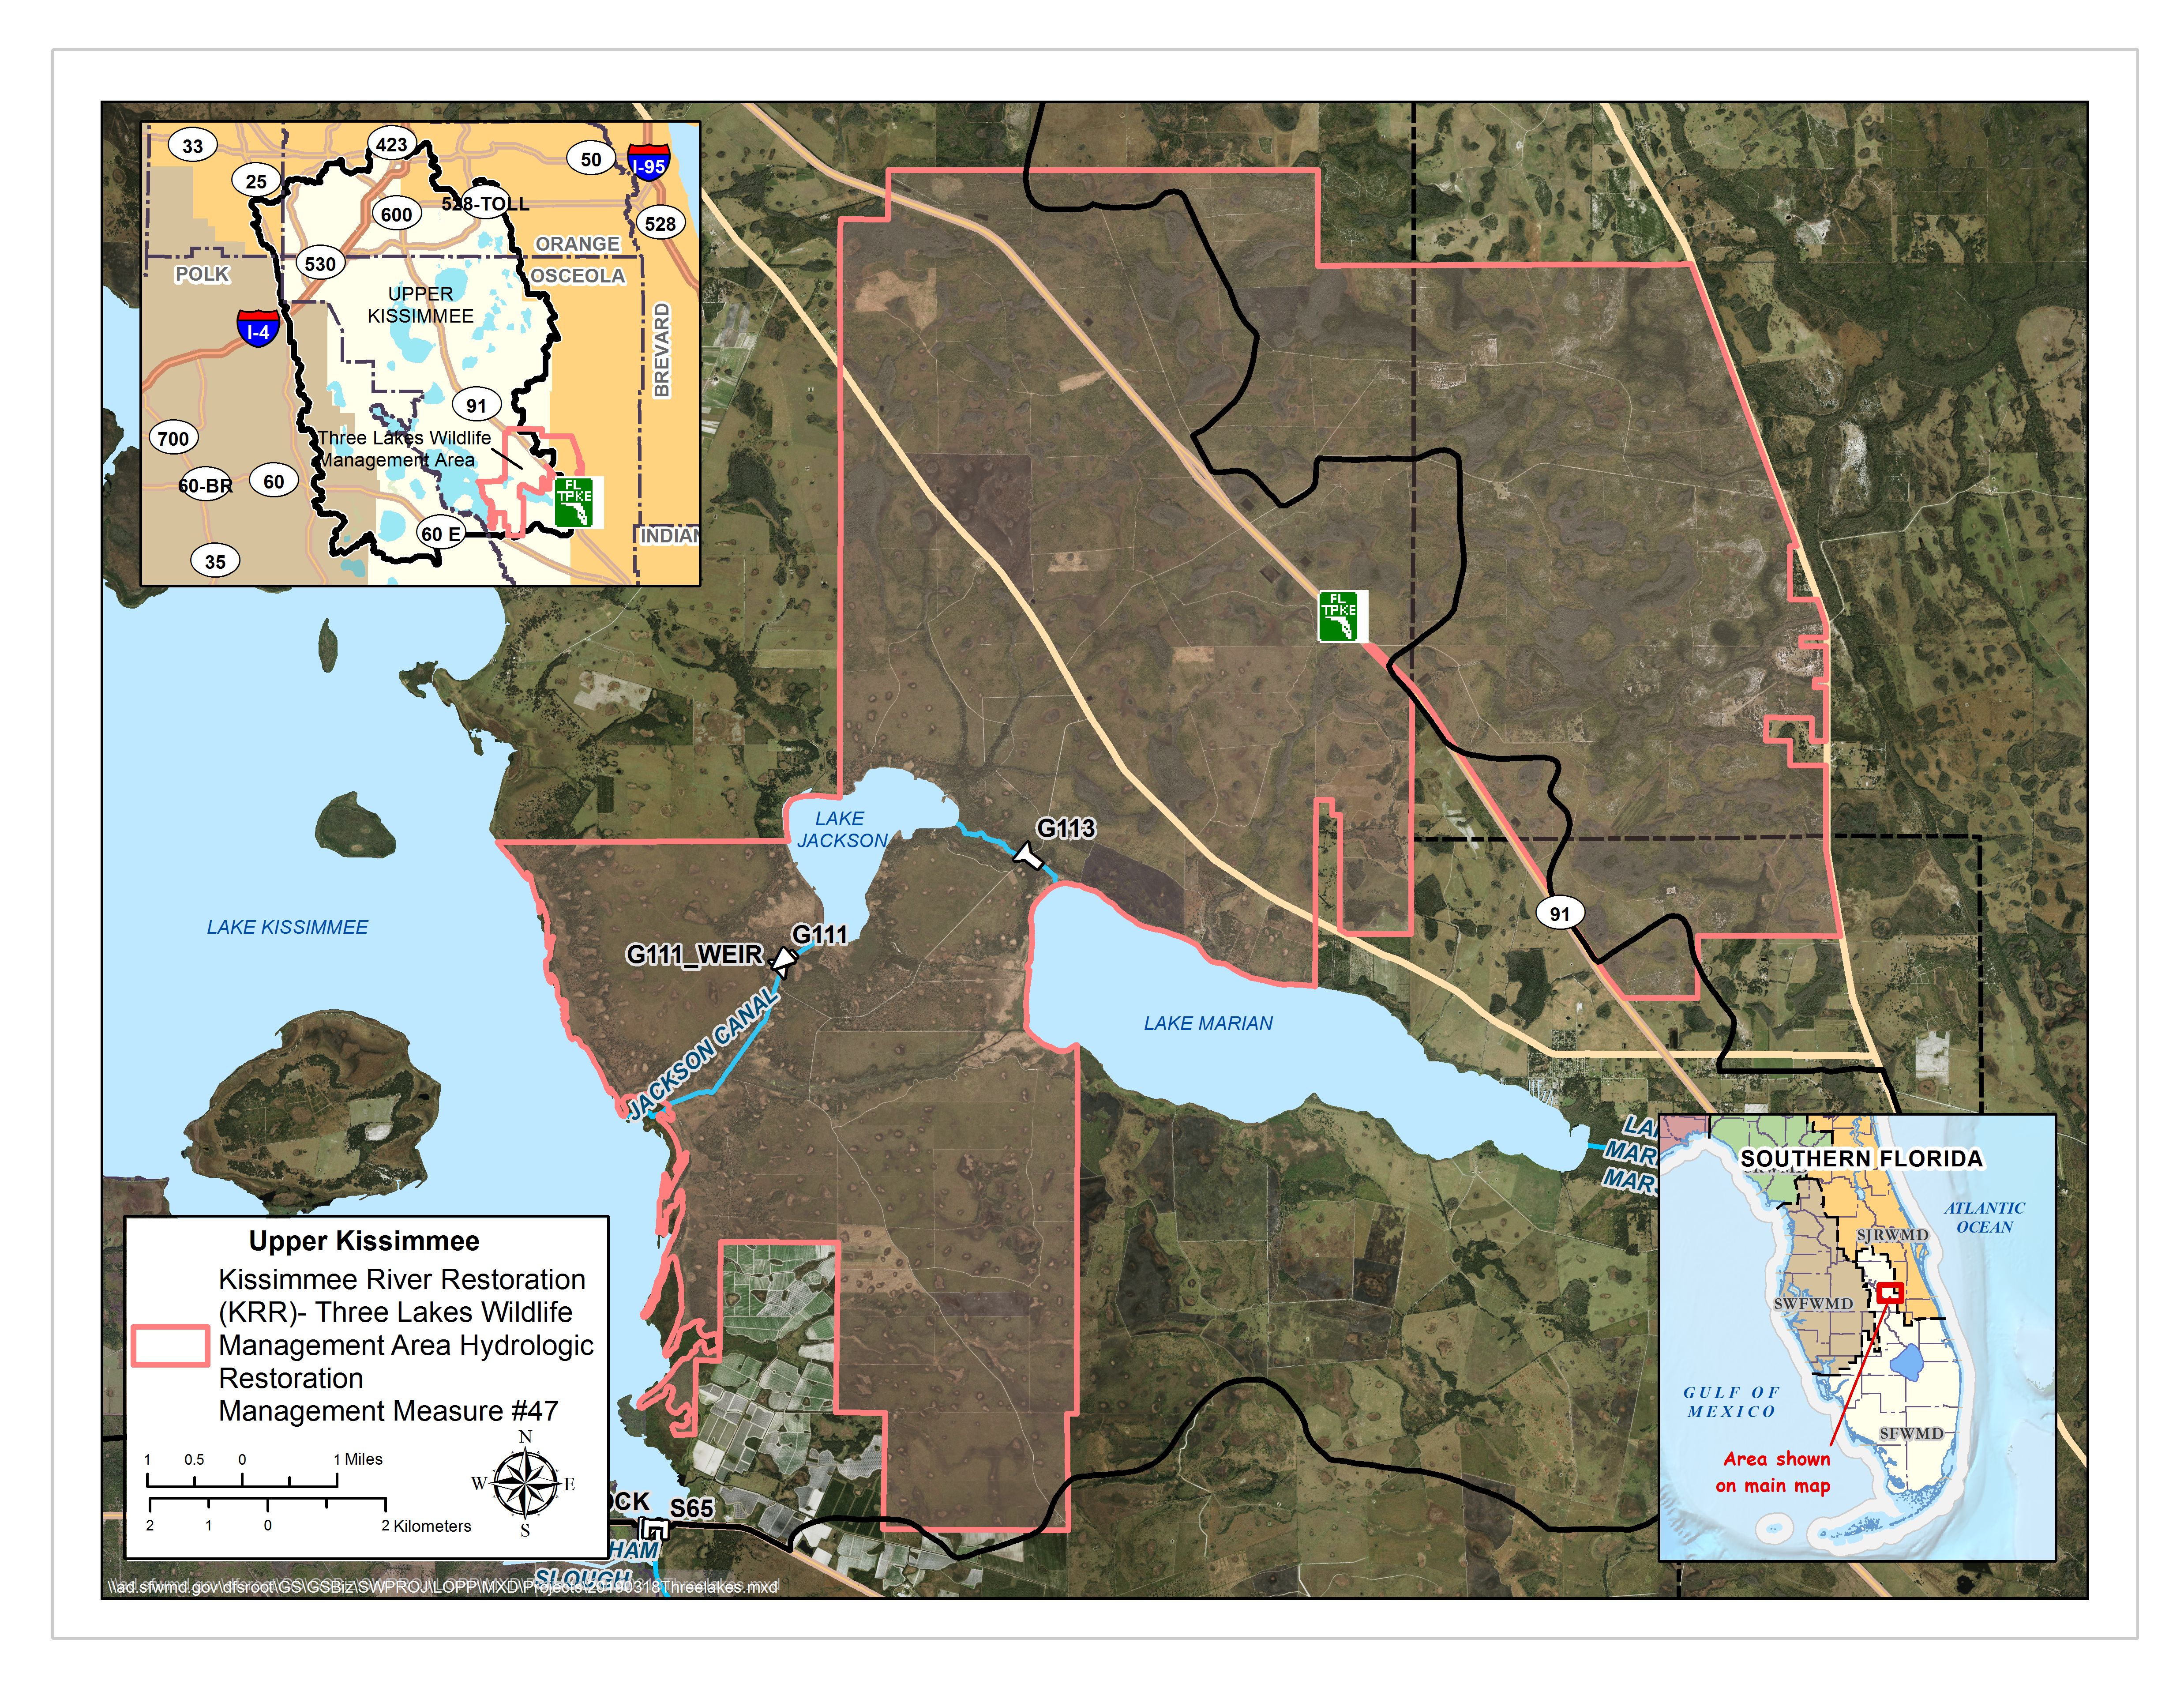 Purpose: Restore hydrology to impacted wetlands associated with the Upper Kissimmee Chain of Lakes
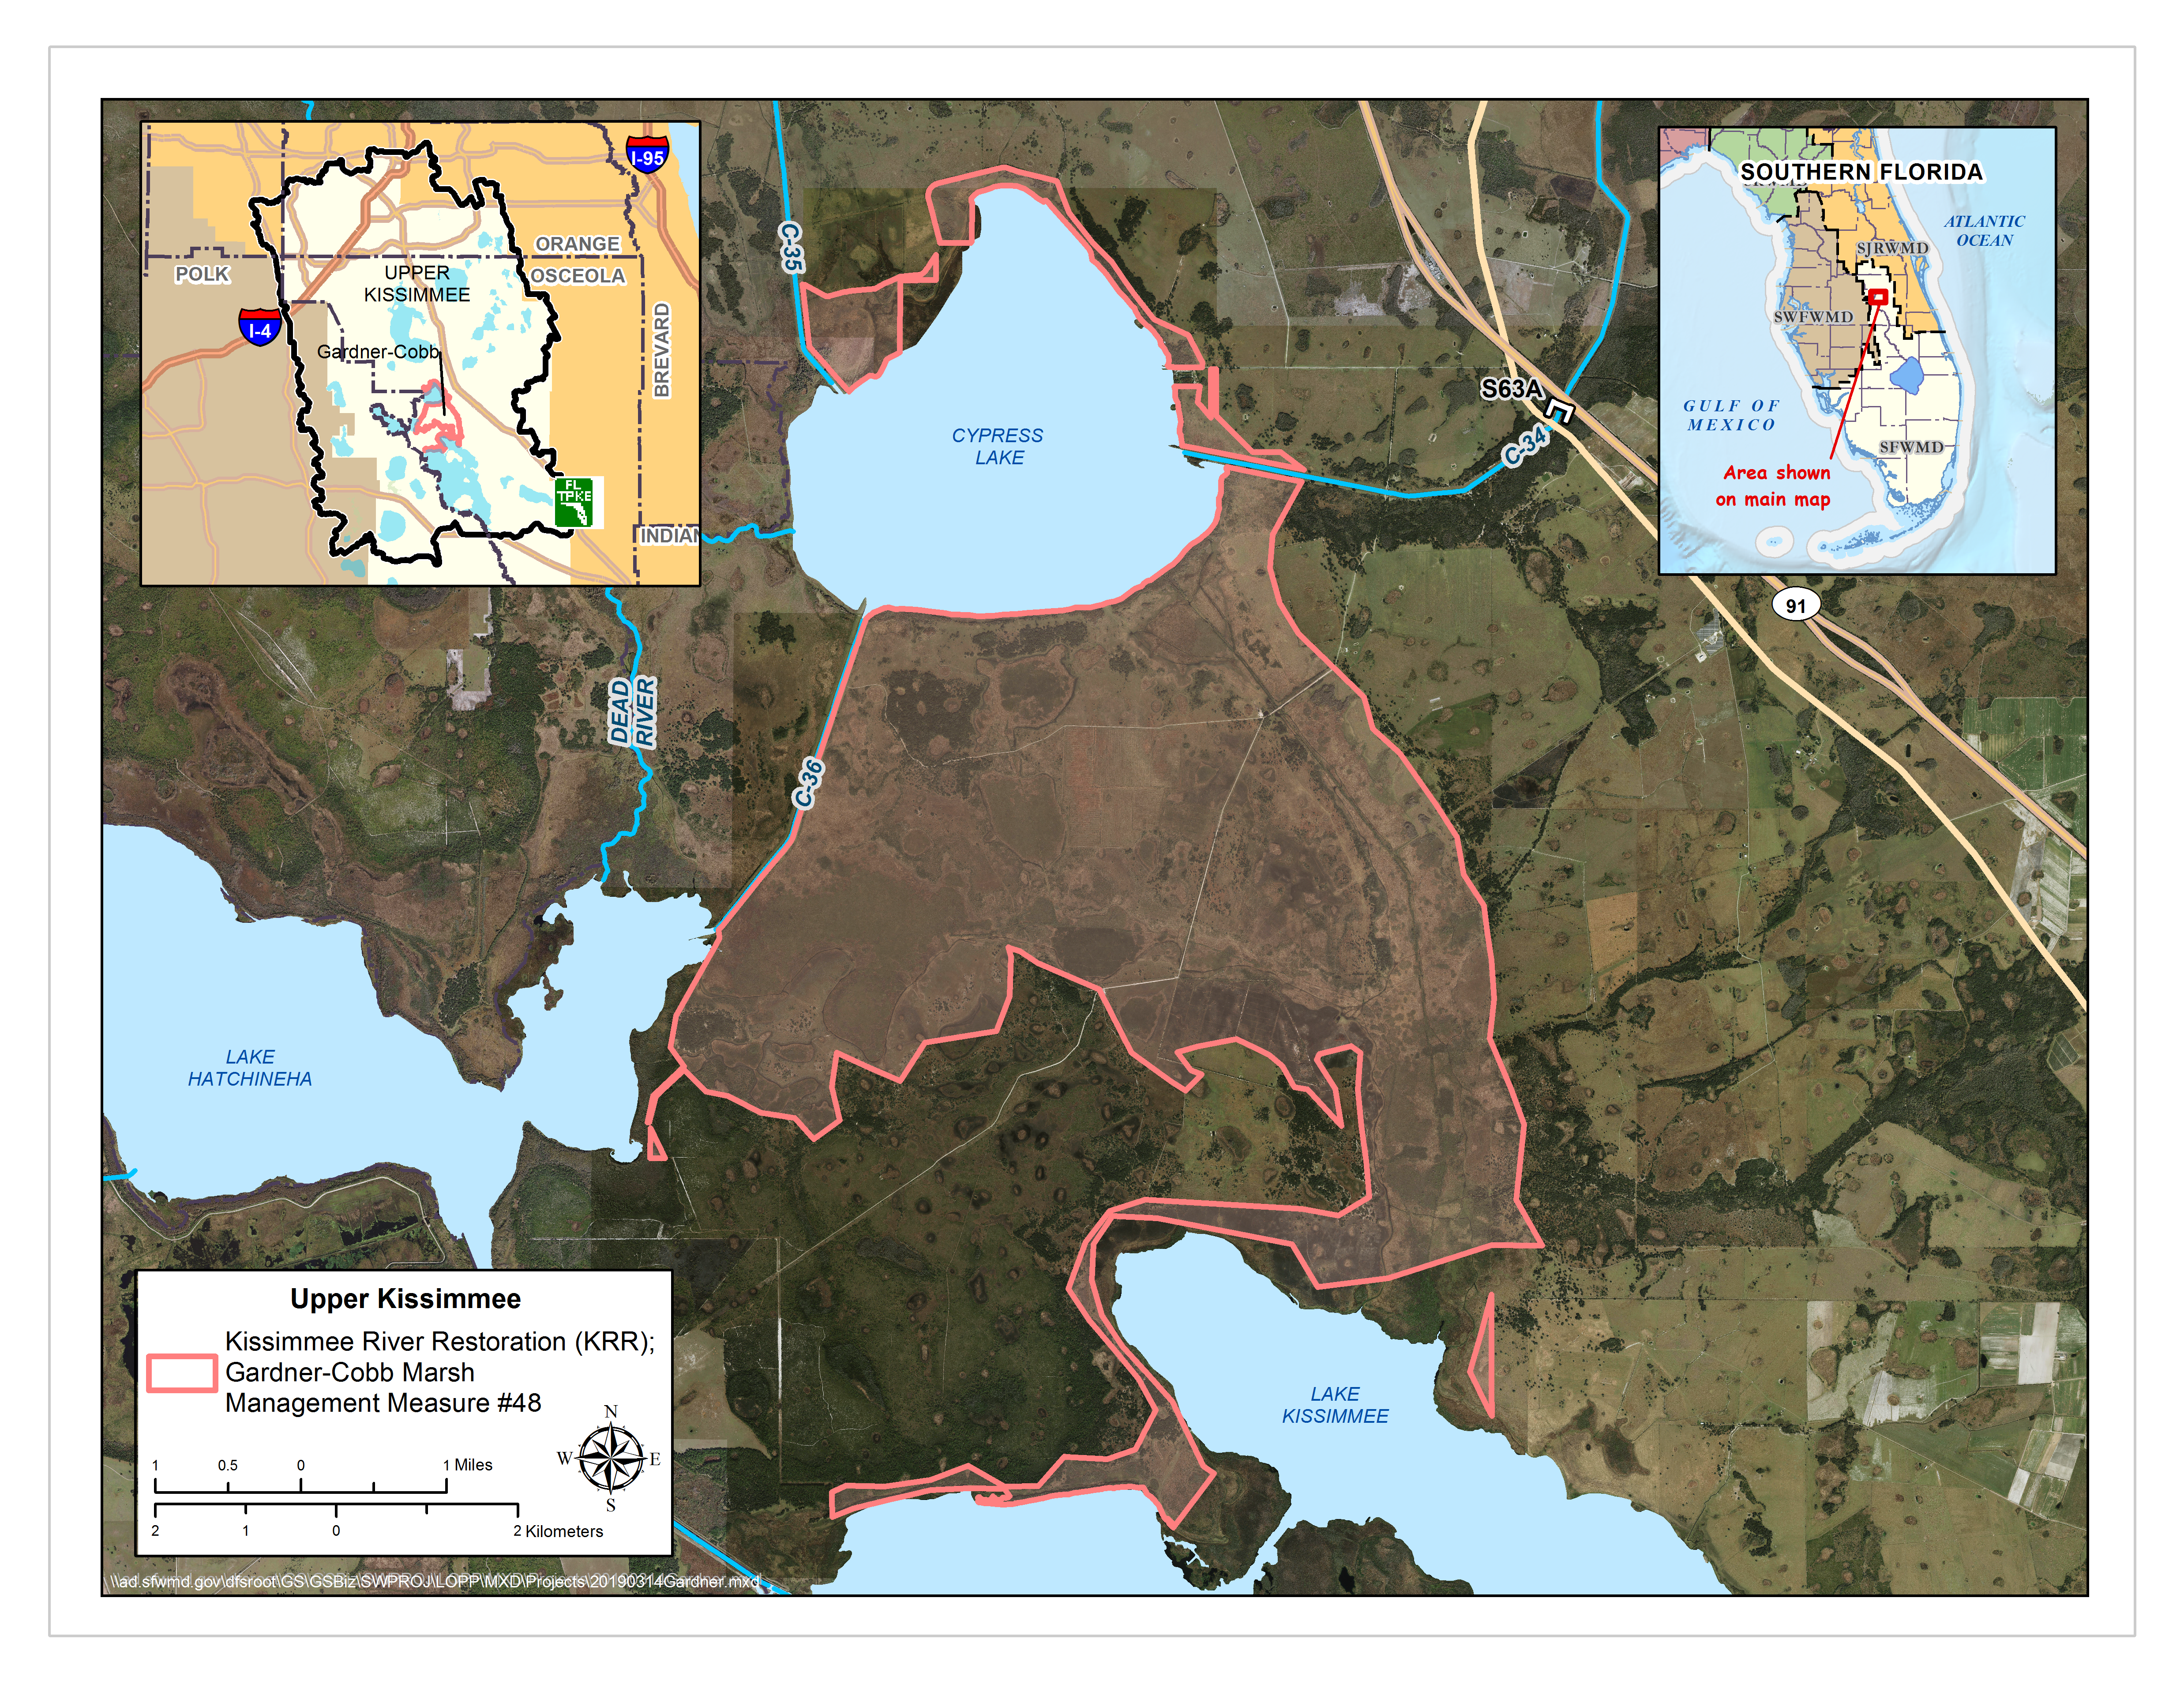 Purpose: Restore hydrology to impacted wetlands associated with the Upper Kissimmee Chain of Lakes
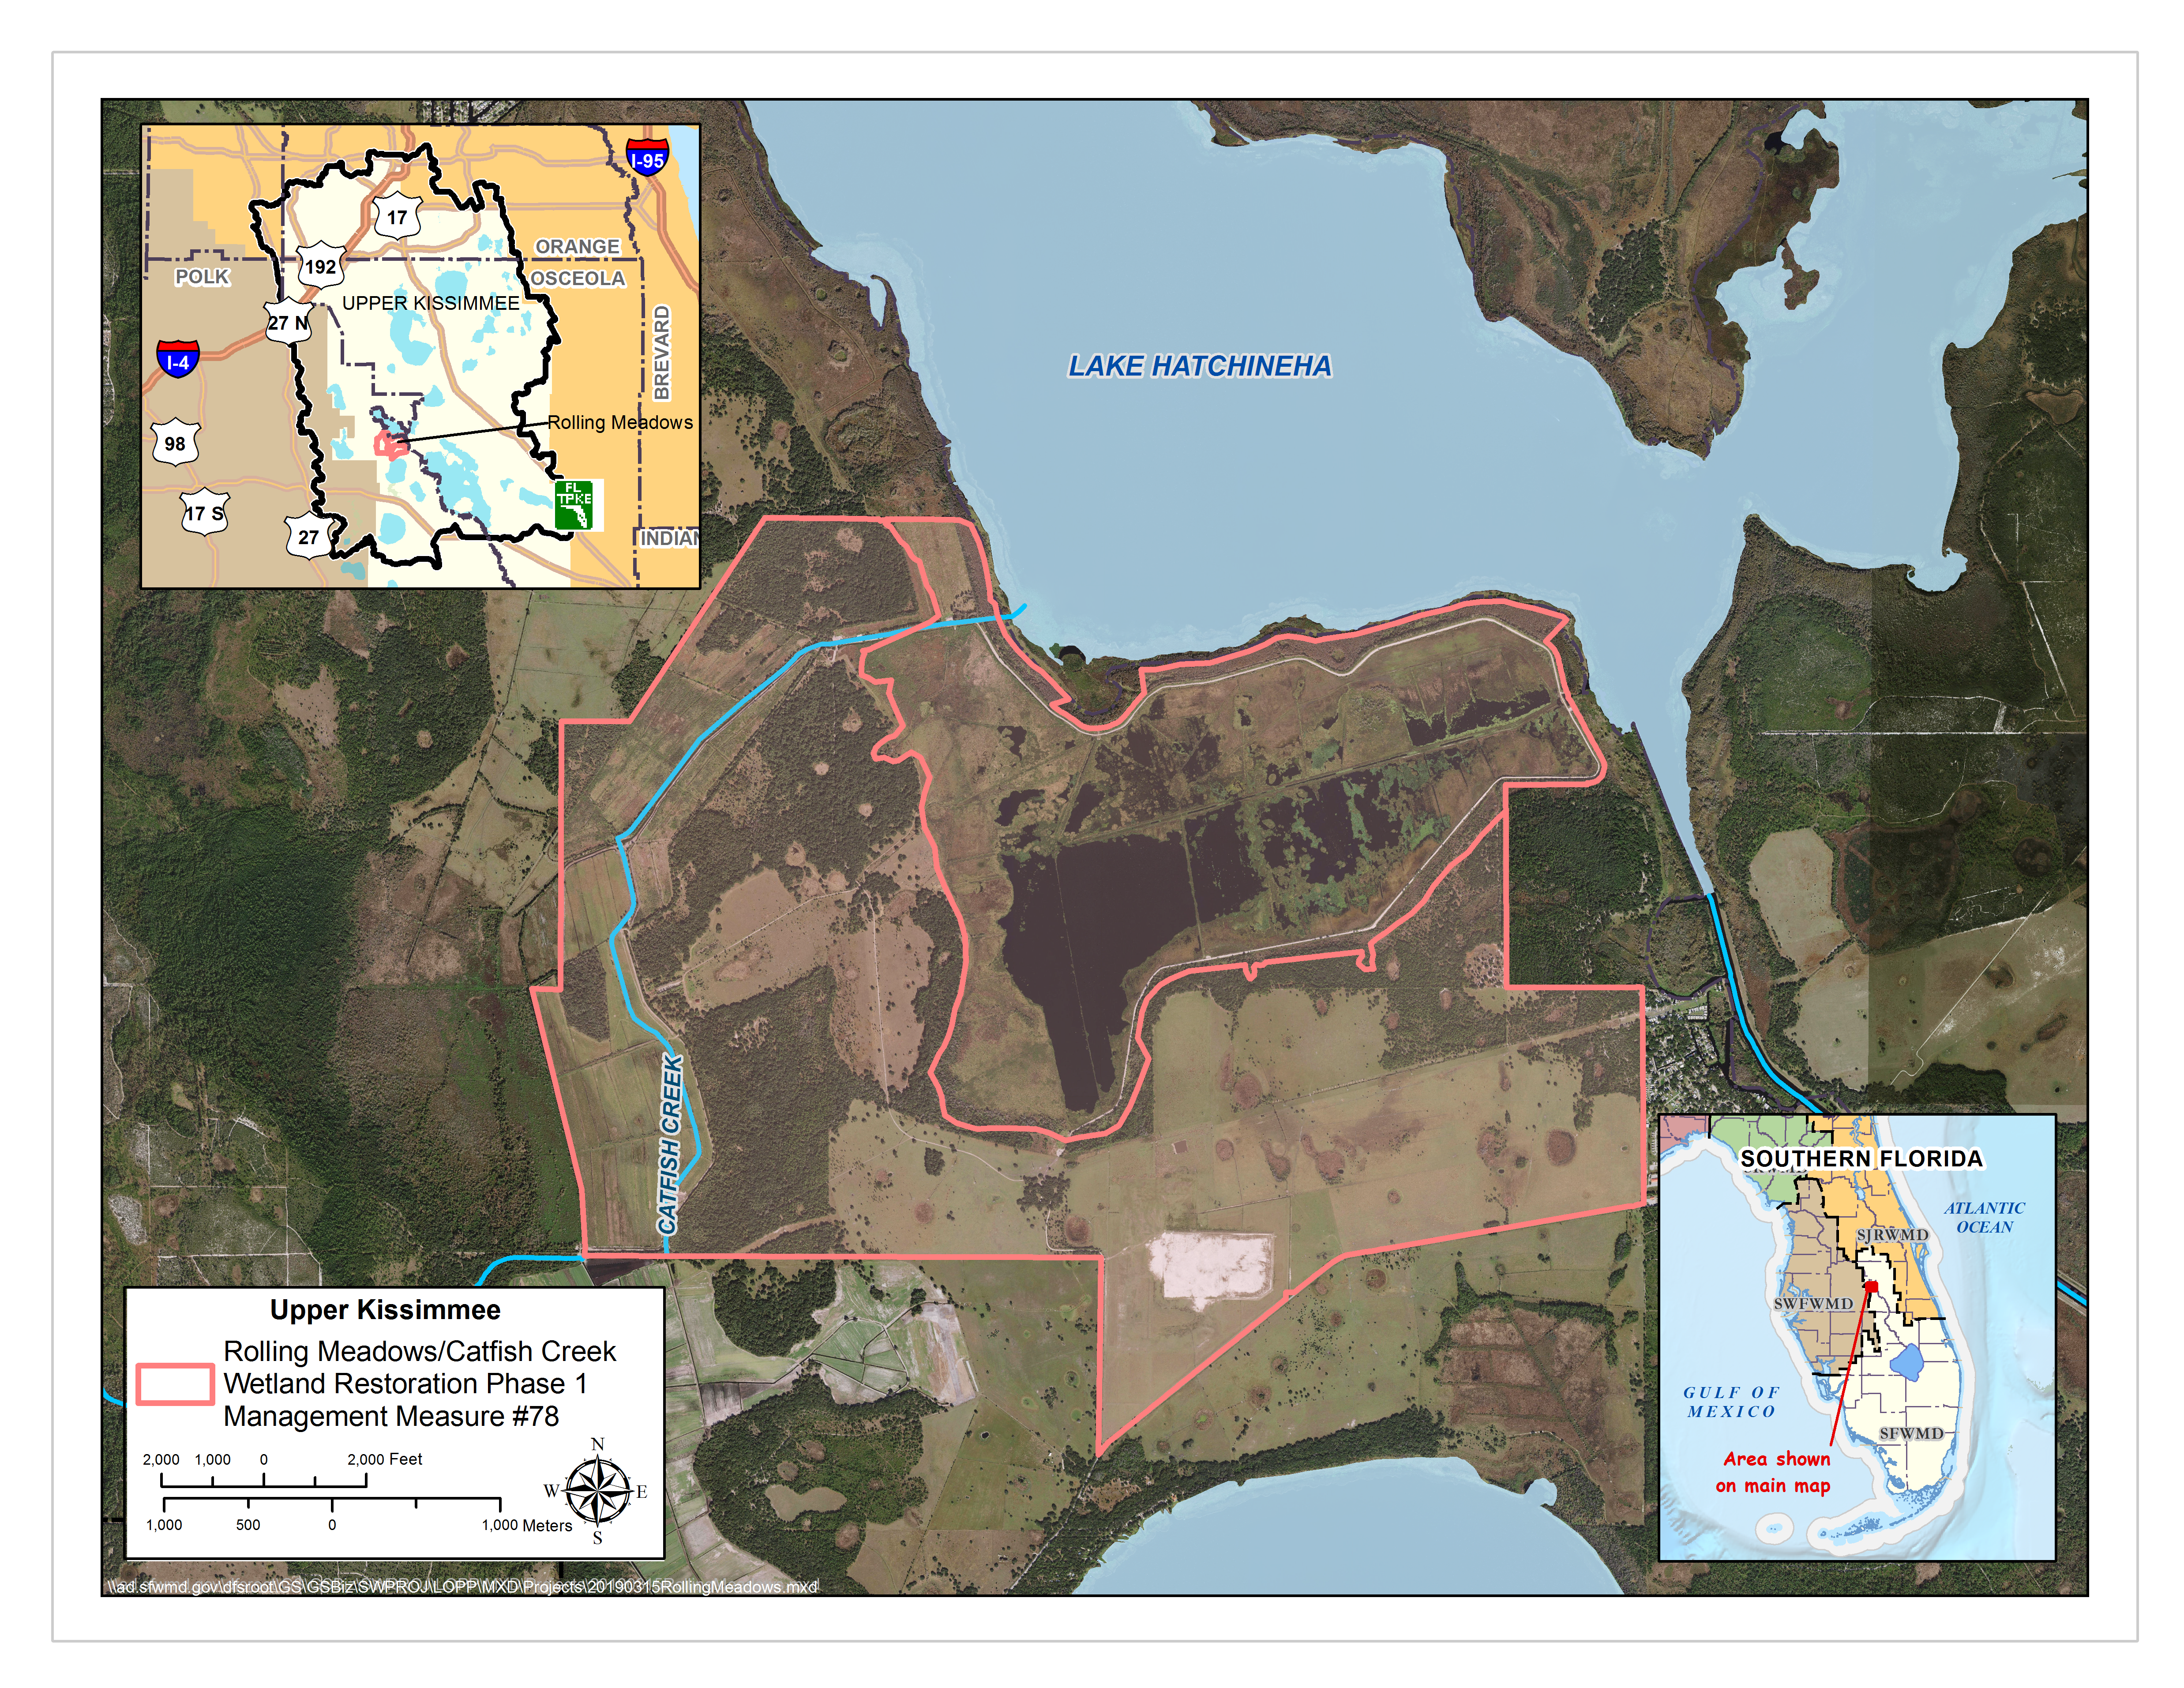 Purpose: Restore a sod farm back to historic lake littoral wetlands connected to Lake Hatchineha.
LOWER KISSIMMEE BASINS
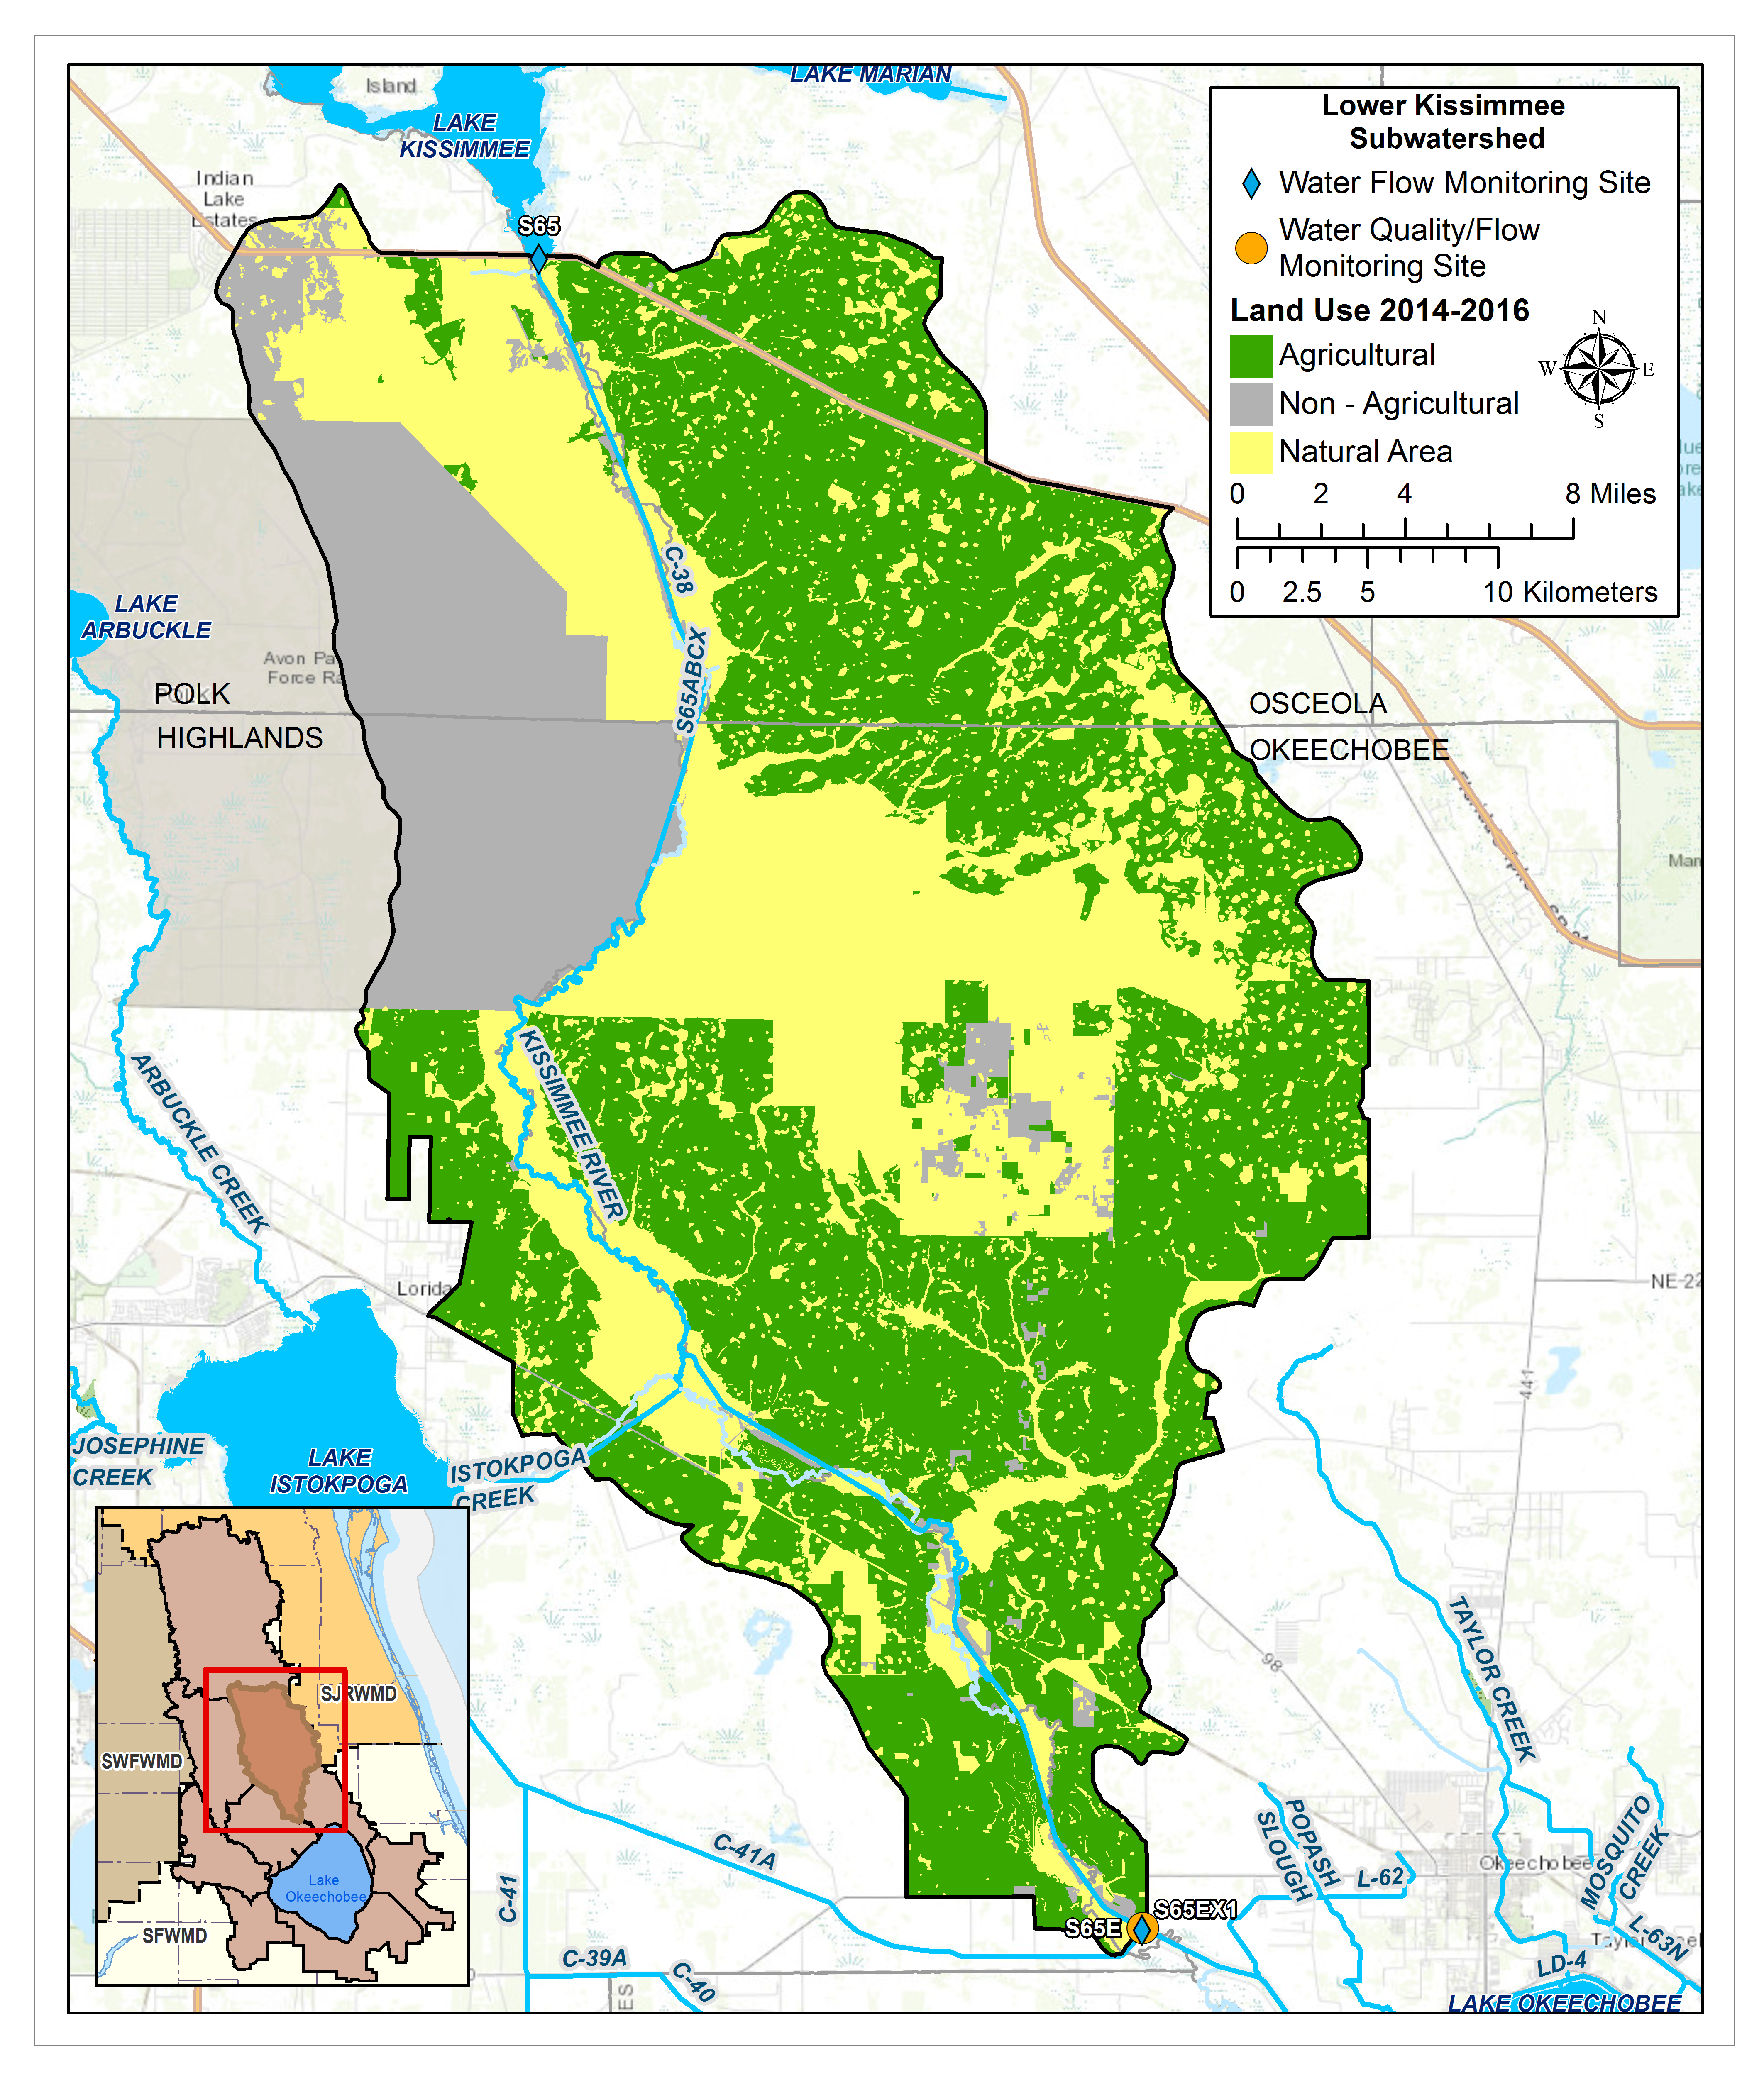
LOWER KISSIMMEE SUBWATERSHED
Total Area: 429,188ac
% Area of Lake Okeechobee Watershed: 12.4%
% TP Load of Lake Okeechobee Watershed: 14.9%
Monitoring Locations: S65,S65E, S65EX1
Flow Issues: No
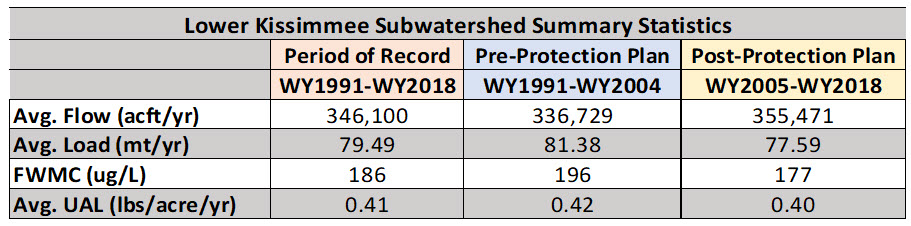
- The flows appeared to stay consistent; no significant difference between the pre and post protection-plan periods and there were no significant trends for flow within any of the periods.
Water Quality Issues: Maybe
- This subwatershed contains two of the four Northern Everglades and Estuaries Protection Program priority basins, (S-65D and S-65E). These basins cannot be independently evaluated because the District does not have monitoring stations in the Old River run portions of the watershed and because of the Kissimmee River Restoration hydrologic changes.
- The total phosphorus (TP) loads had a statistically significant increasing trend during the post-protection plan period.
- The total phosphorus (TP) flow-weighted mean concentrations (FWMC) are twice as high as Upper Kissimmee (177 μg/L Lower vs. 89 μg/L Upper) in the post-protection plan period).
- The median FWMC are high in the post-protection plan period (216 μg/L).
- Because FWMC is calculated by subtraction of S-65 flows and flow-concentration products from those of S-65E, this occasionally yields numerical anomalies. For example, in a period where the Kissimmee River floodplain experienced a large increase in water stored, the “net” discharge through S-65E may be negative. Recommend looking at data S-65E flows and loads without subtraction of S-65 data and compare with S-65.
- Preliminary modeling estimates the Lower Kissimmee sub-watershed may have reduced TP loads to Lake Okeechobee after the KRR project is completed and the restored vegetation mosaic has returned to the floodplain.

>>Additional Technical Information
PROJECTS LOCATED IN THIS SUBWATERSHED
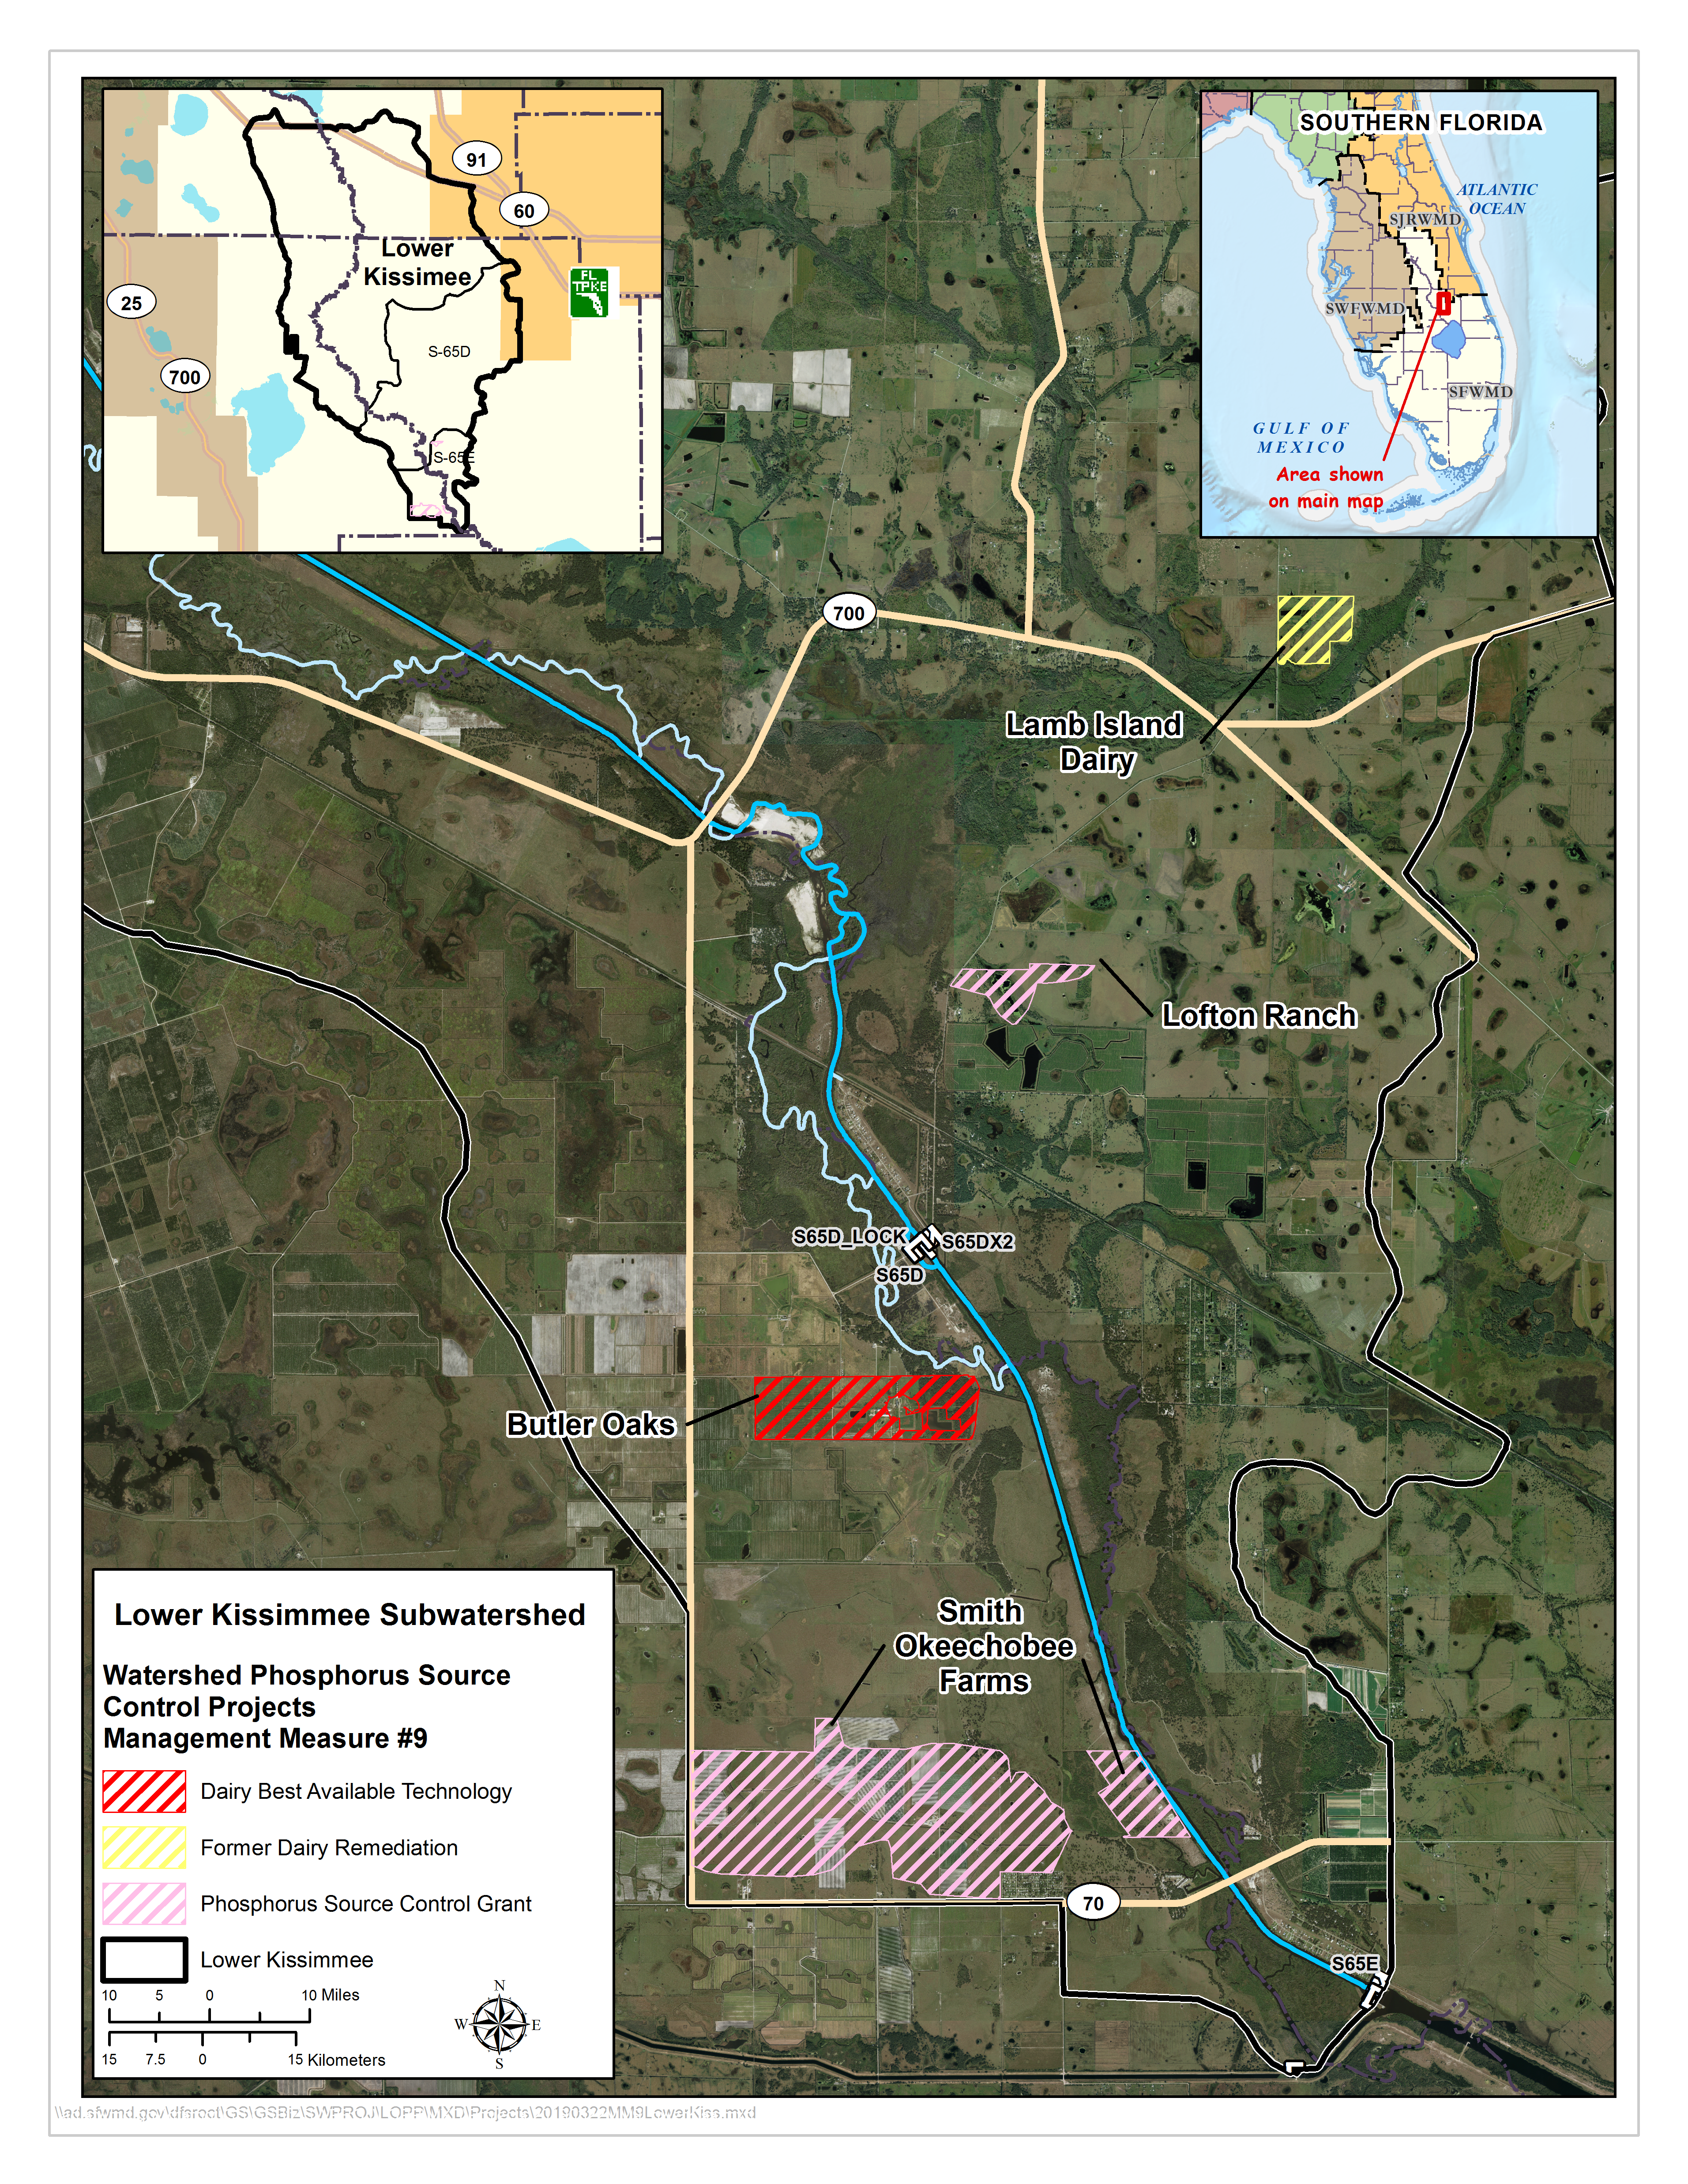 Purpose: Reduce phosphorus exports to Lake Okeechobee in the four priority basins (S-65D, S-65E, S-154, and S-191).
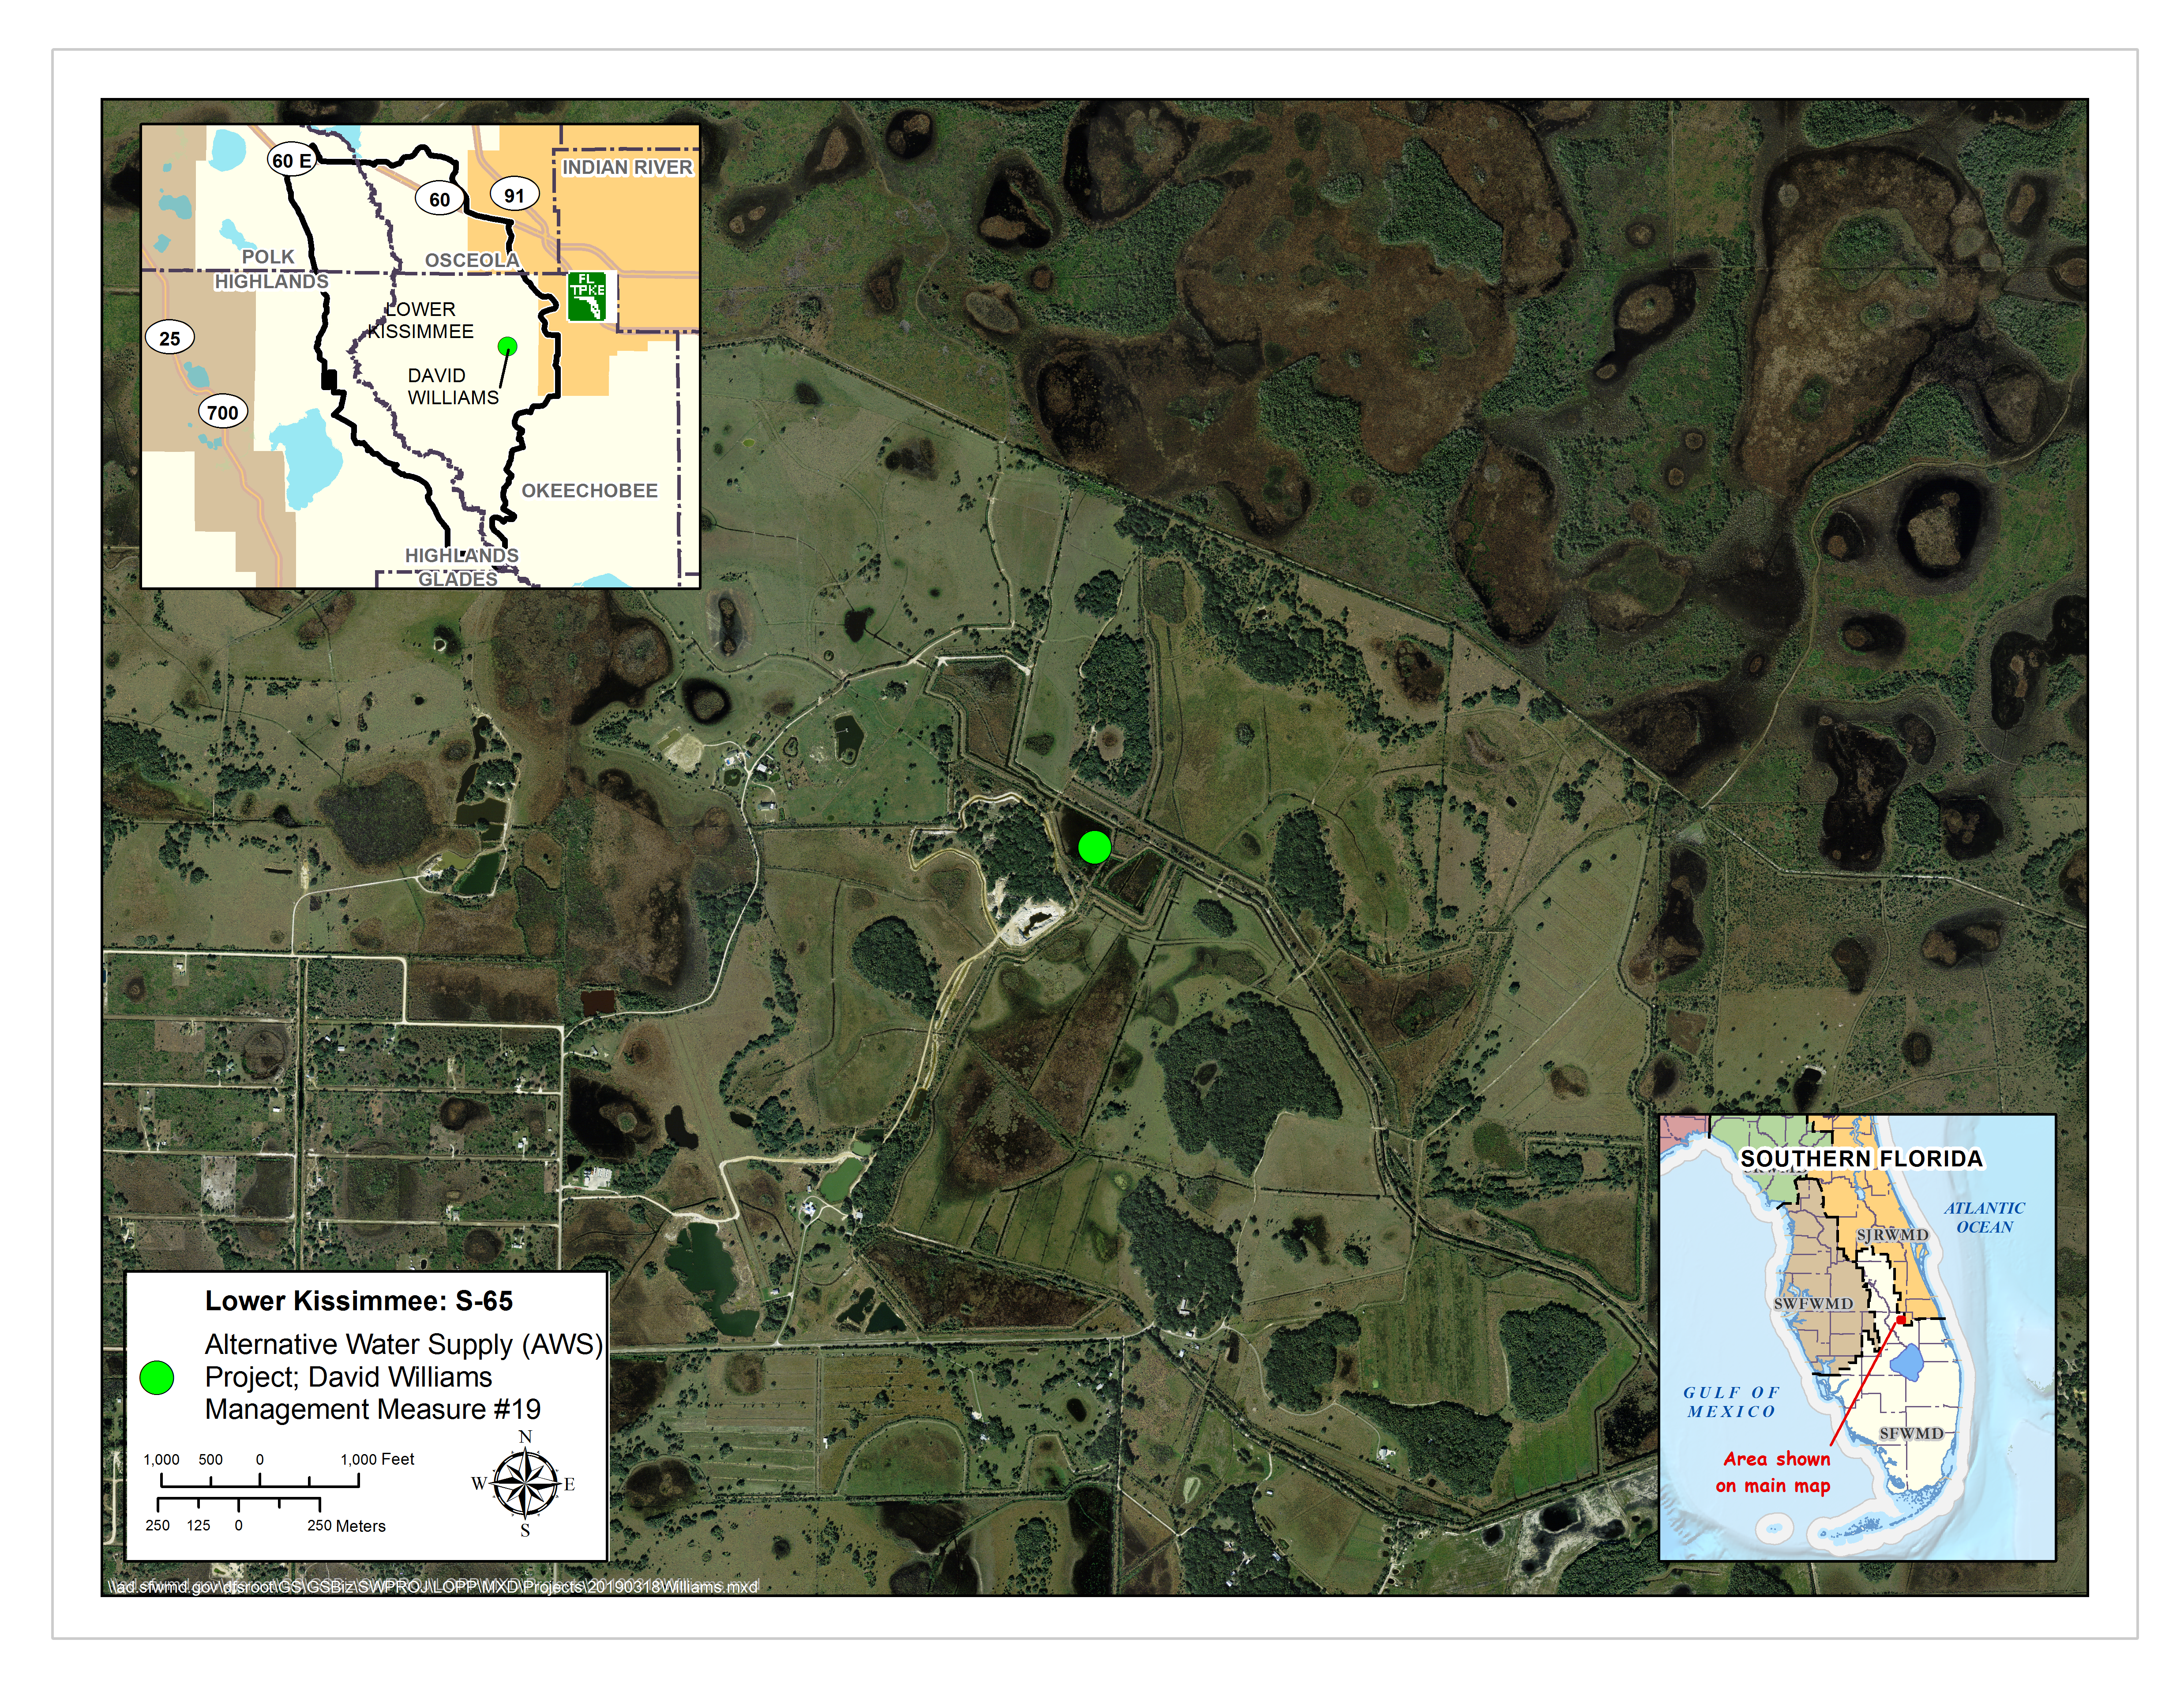
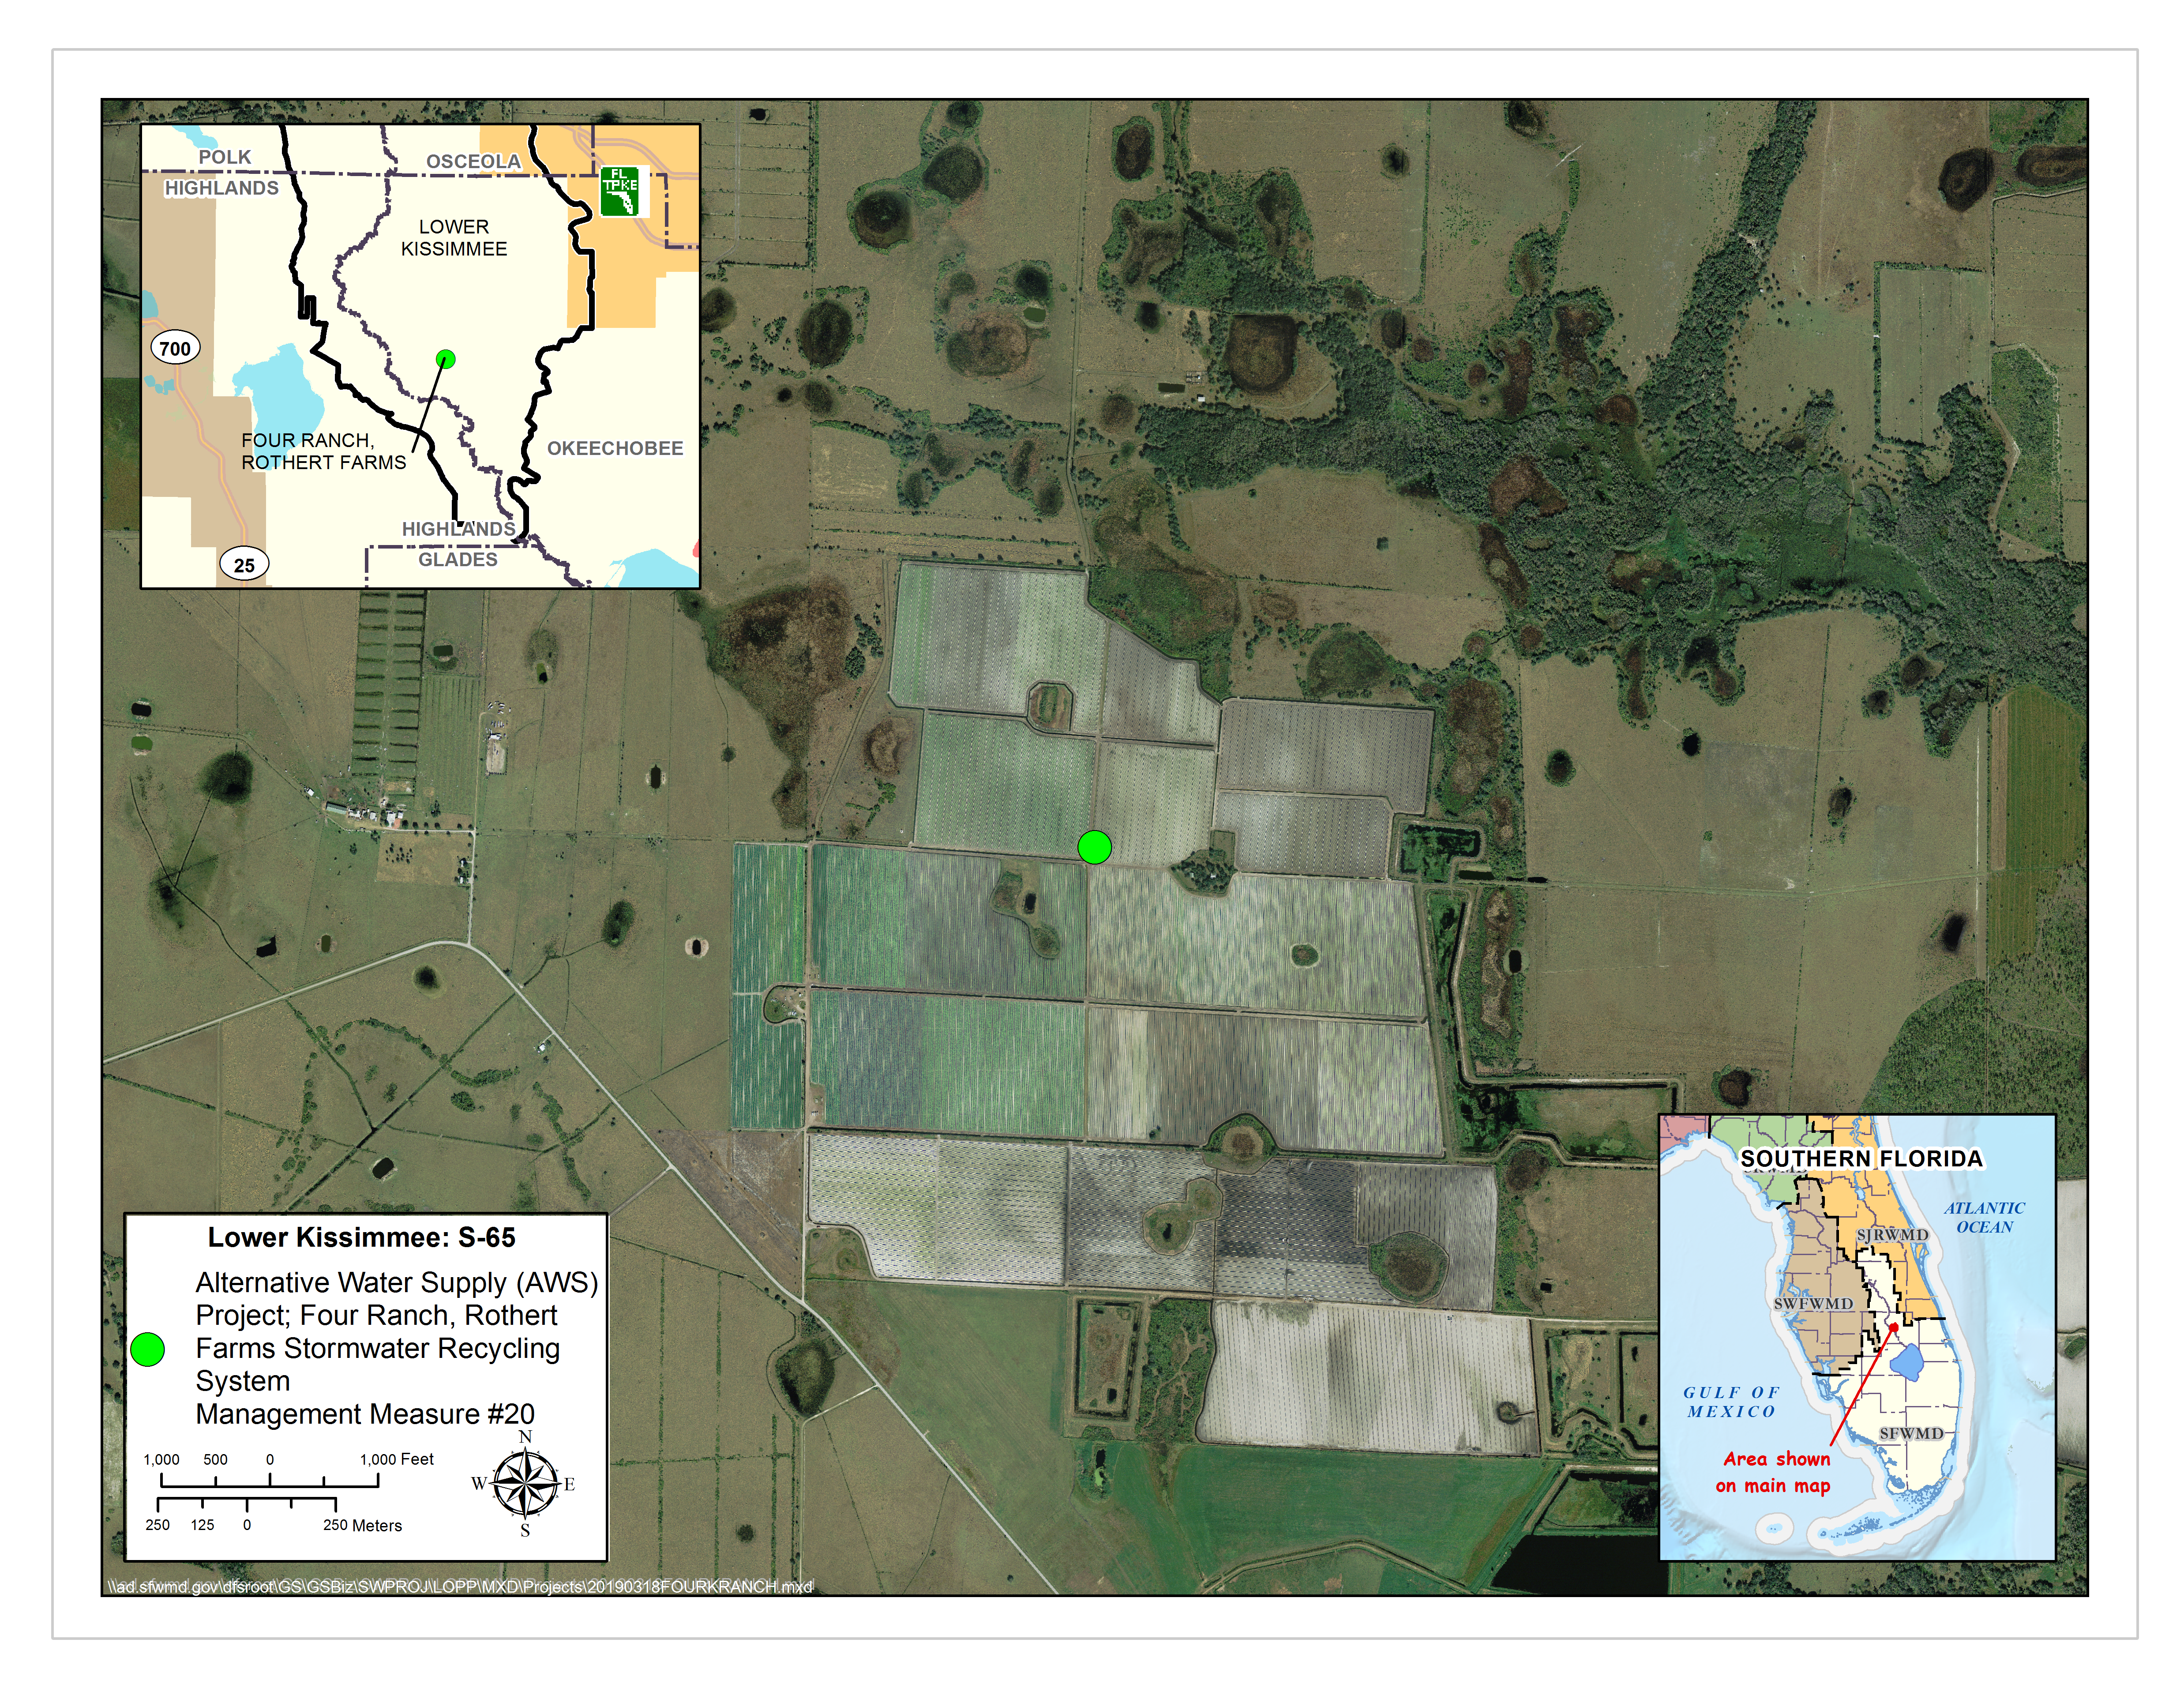
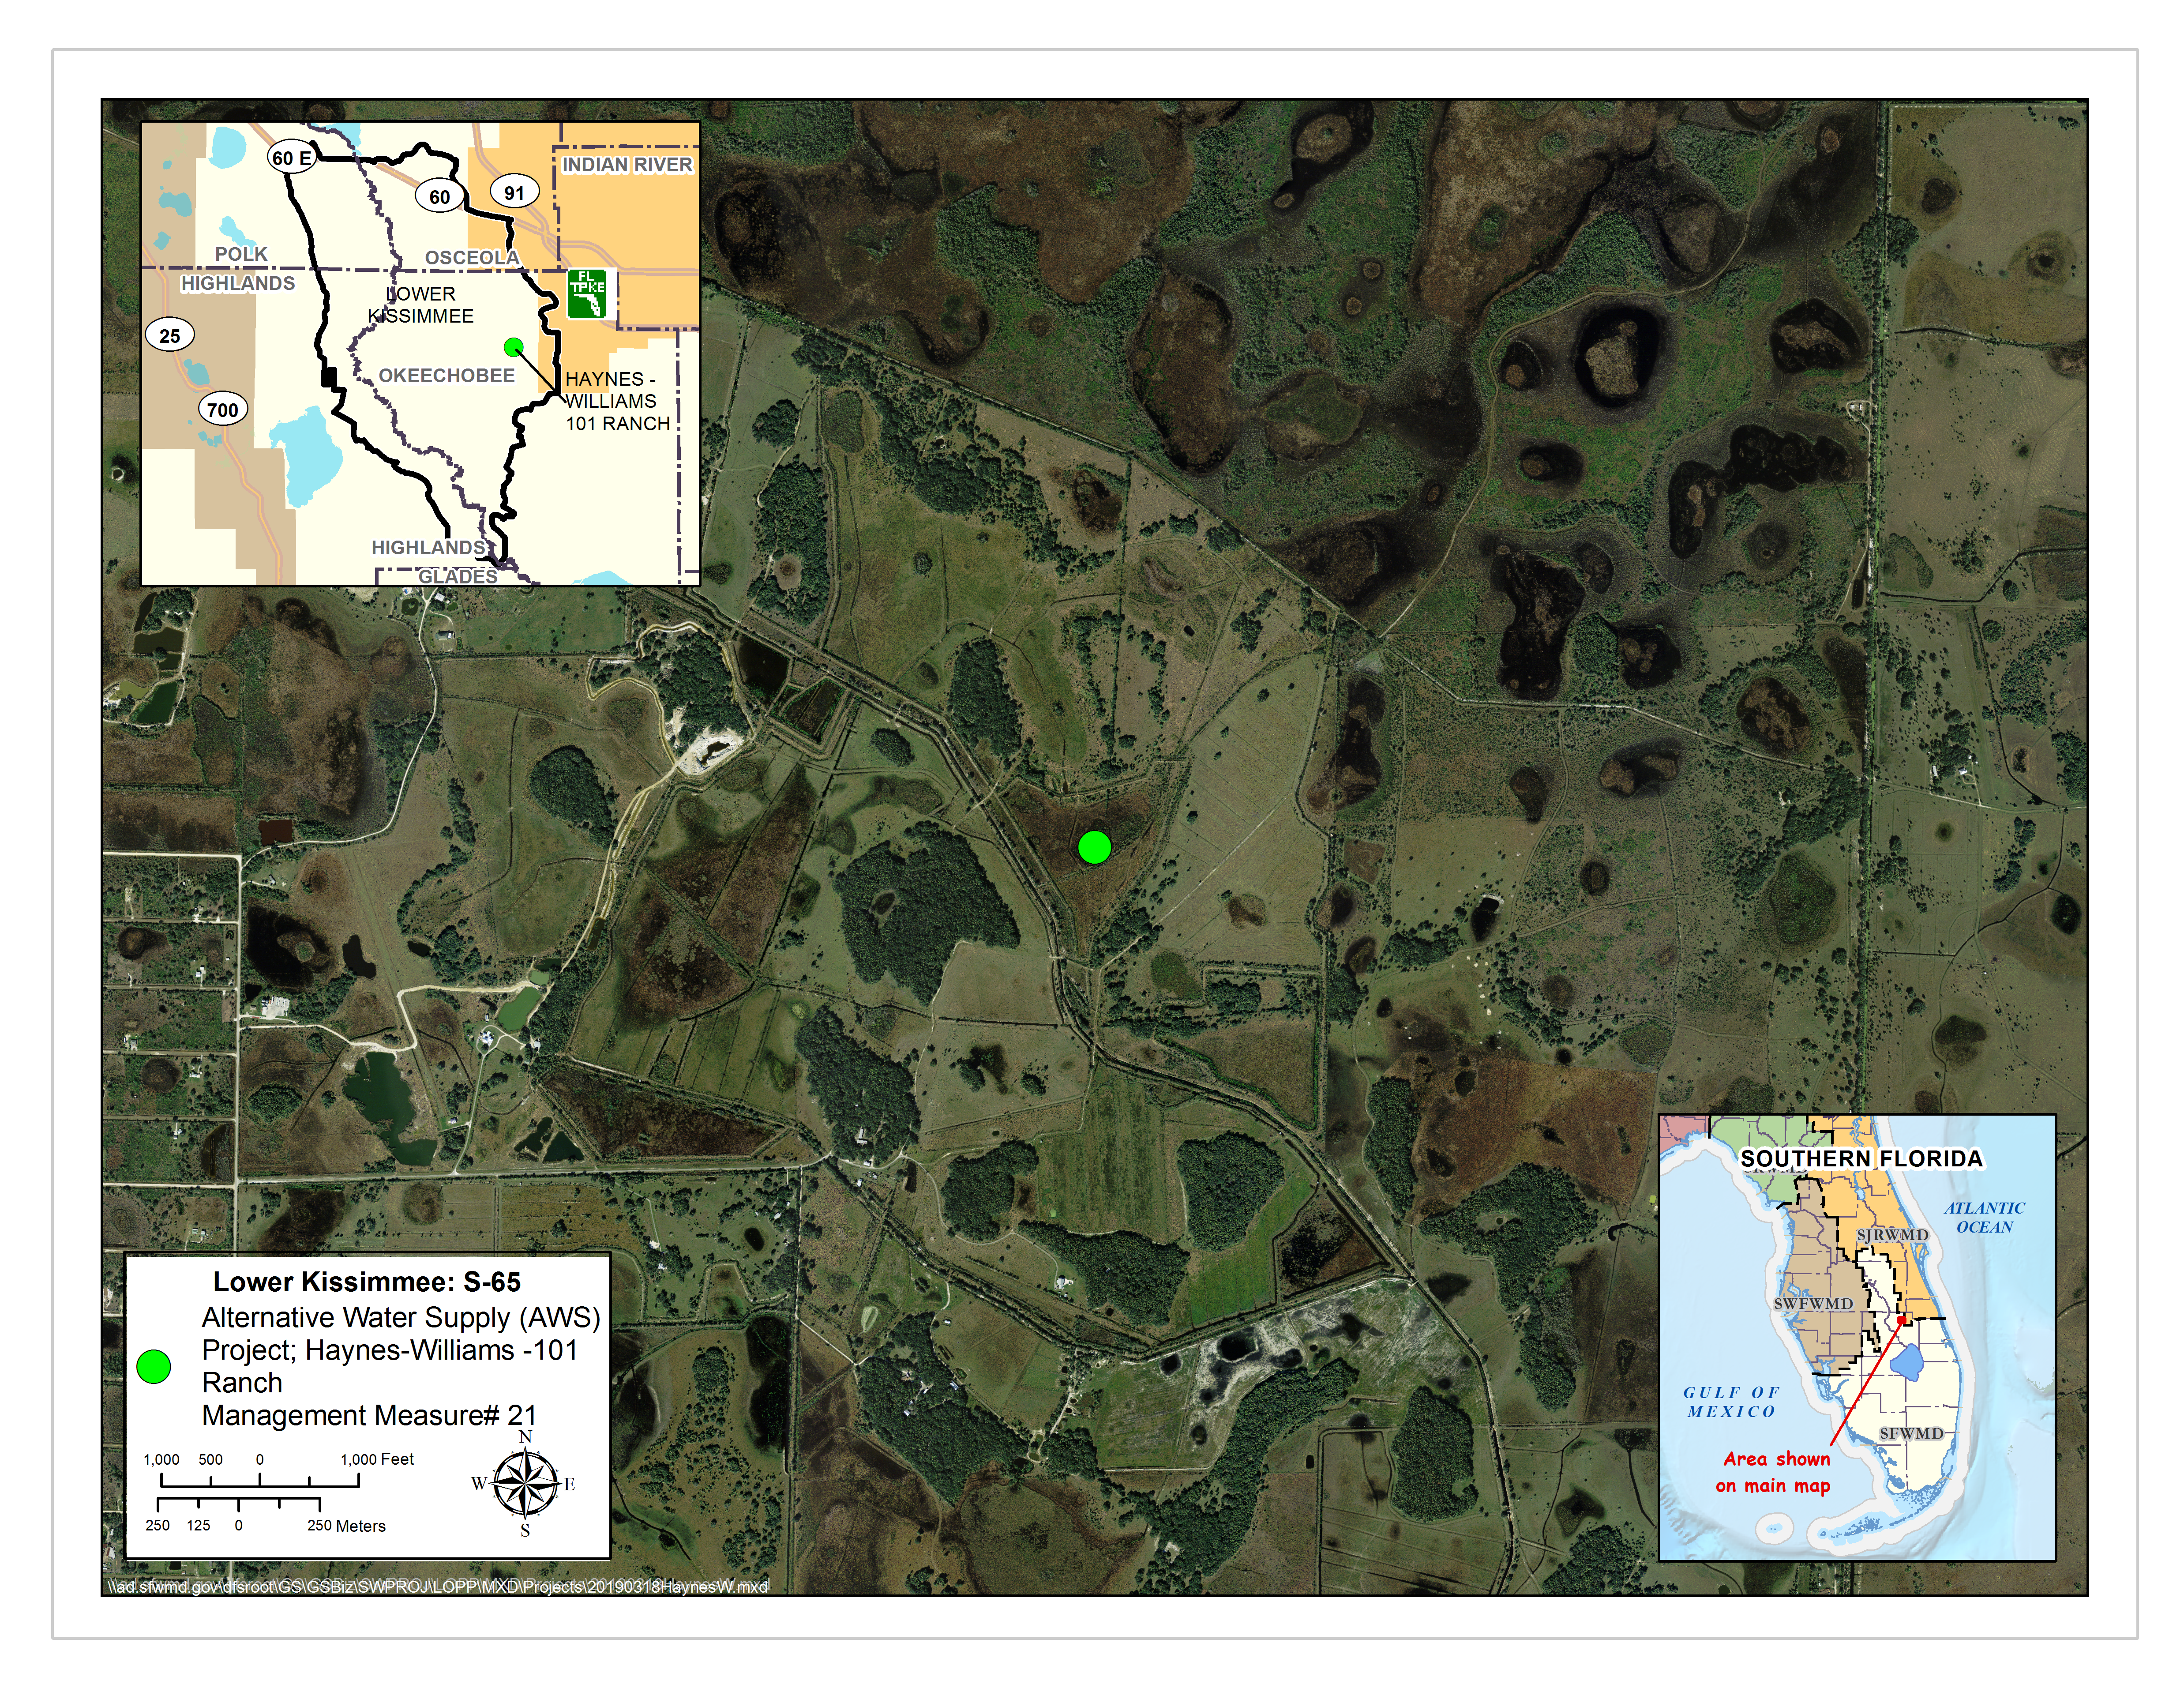
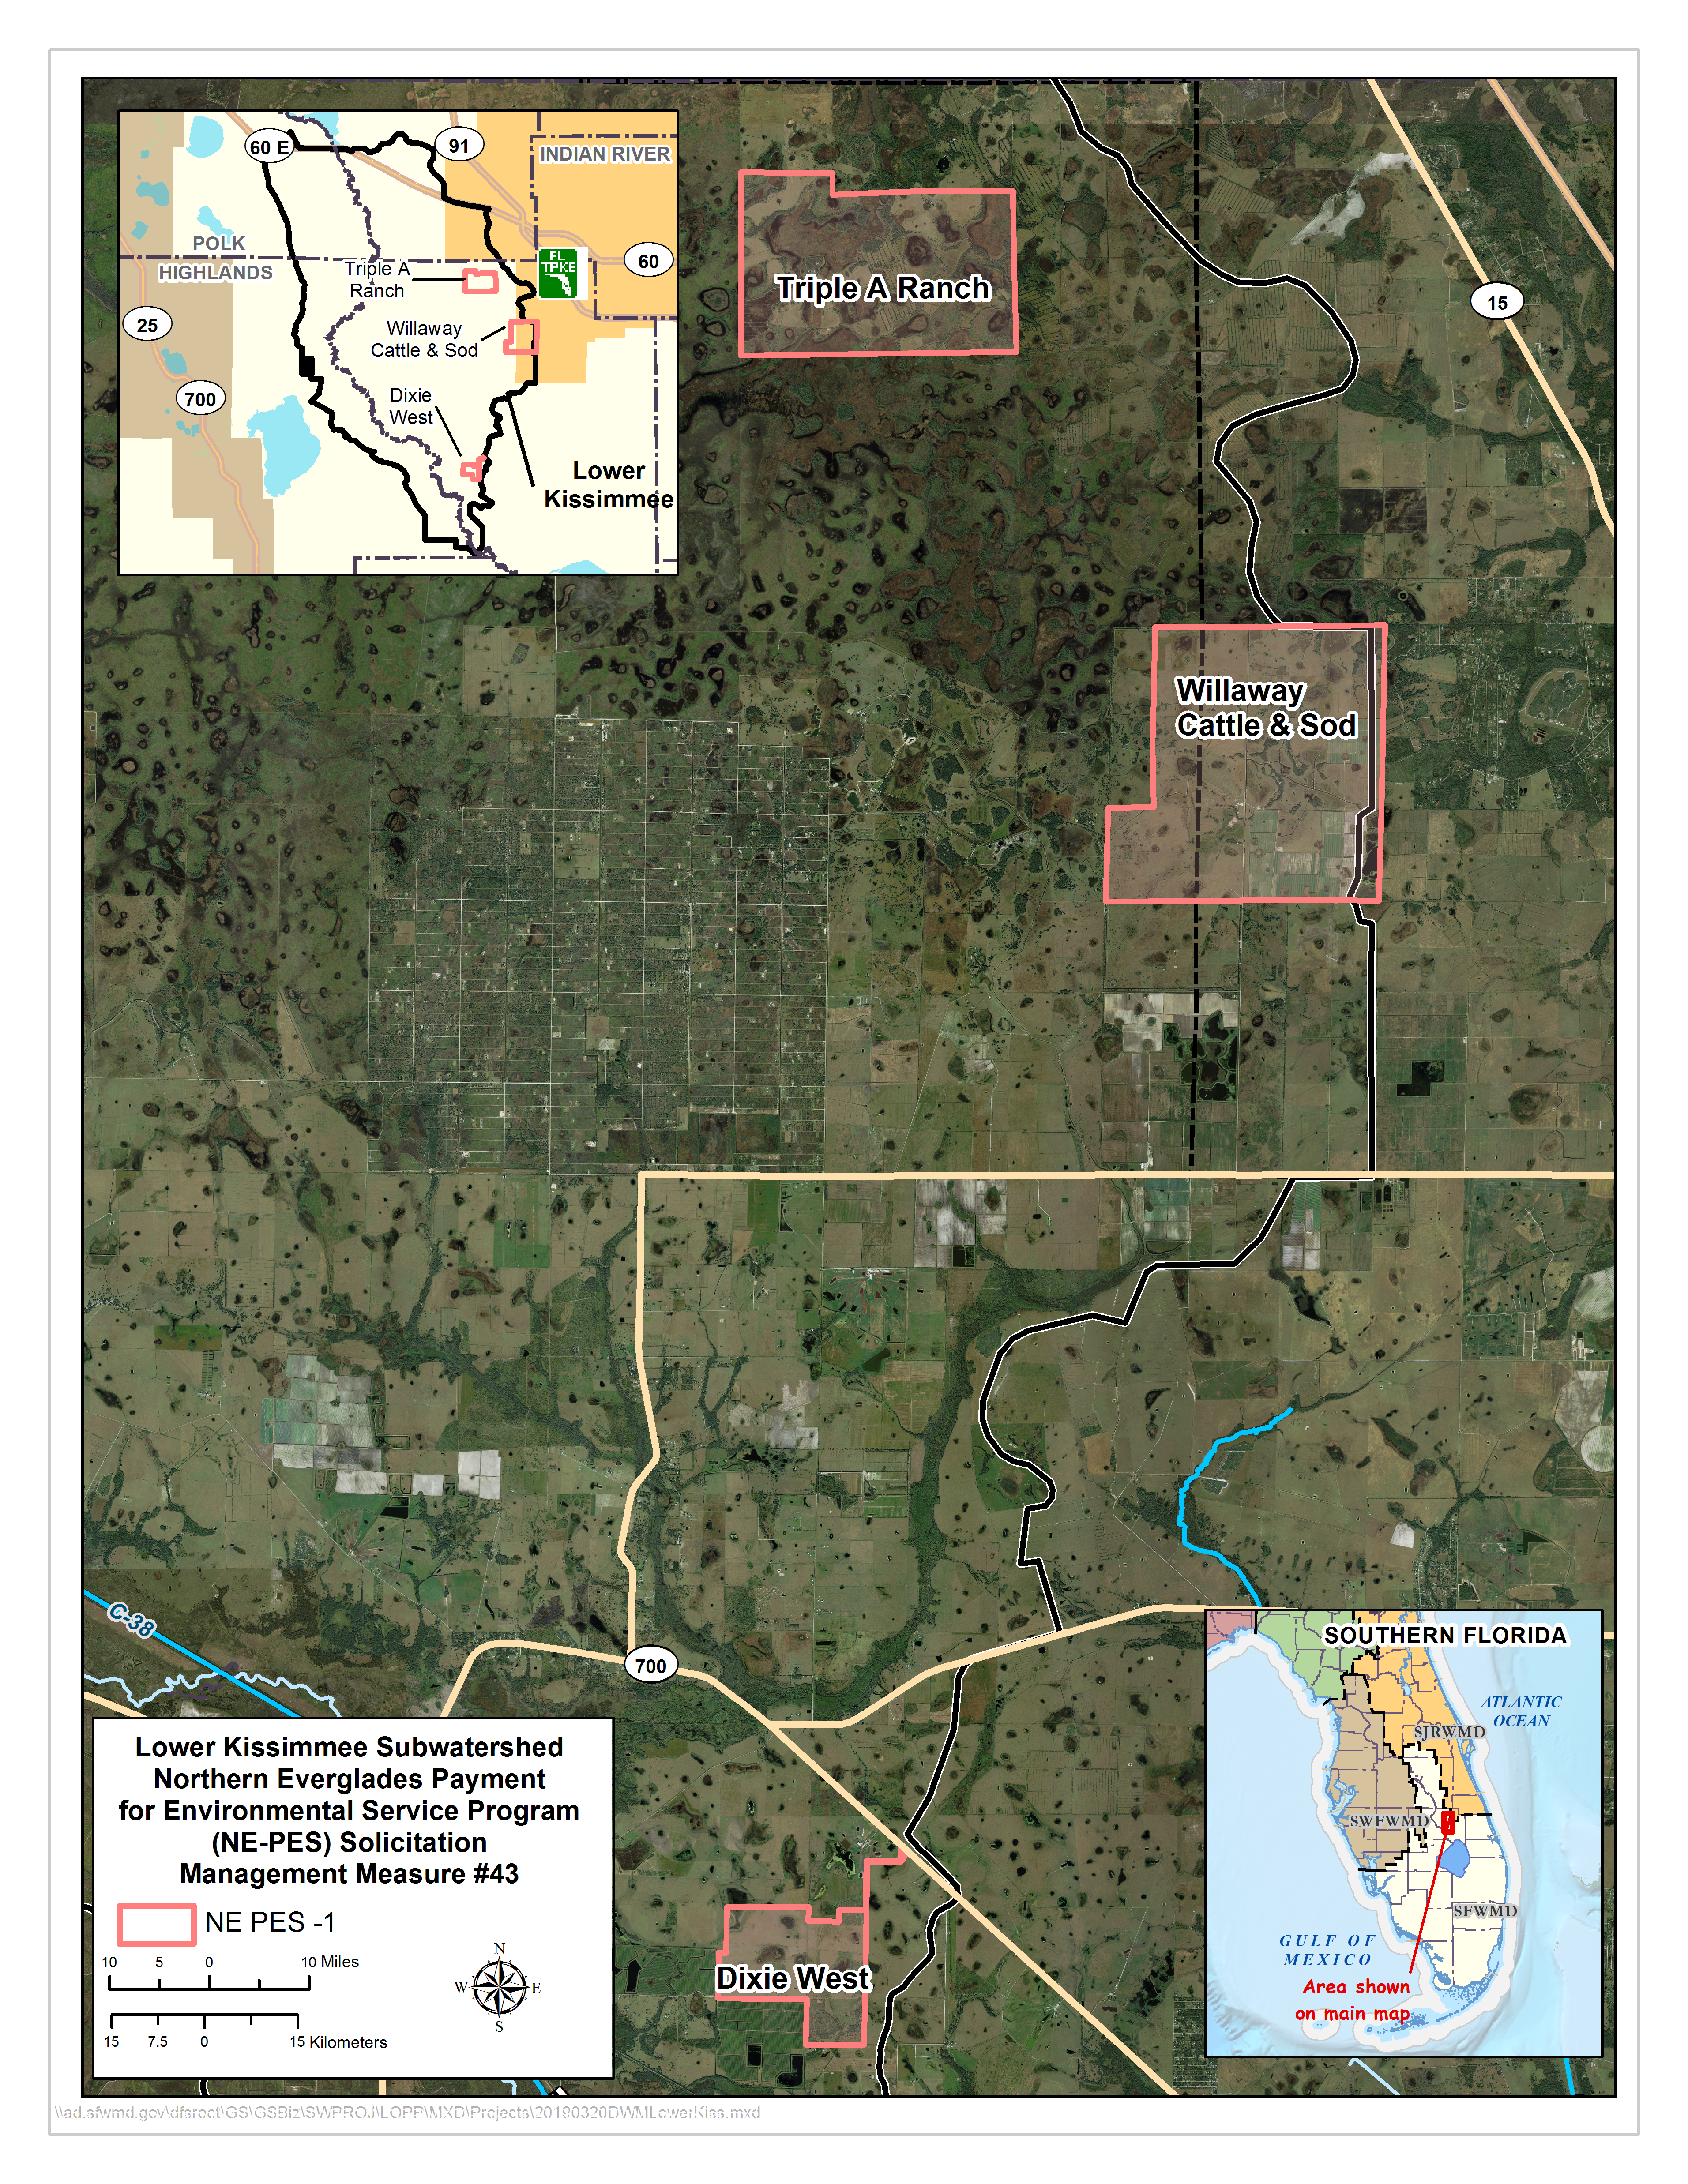
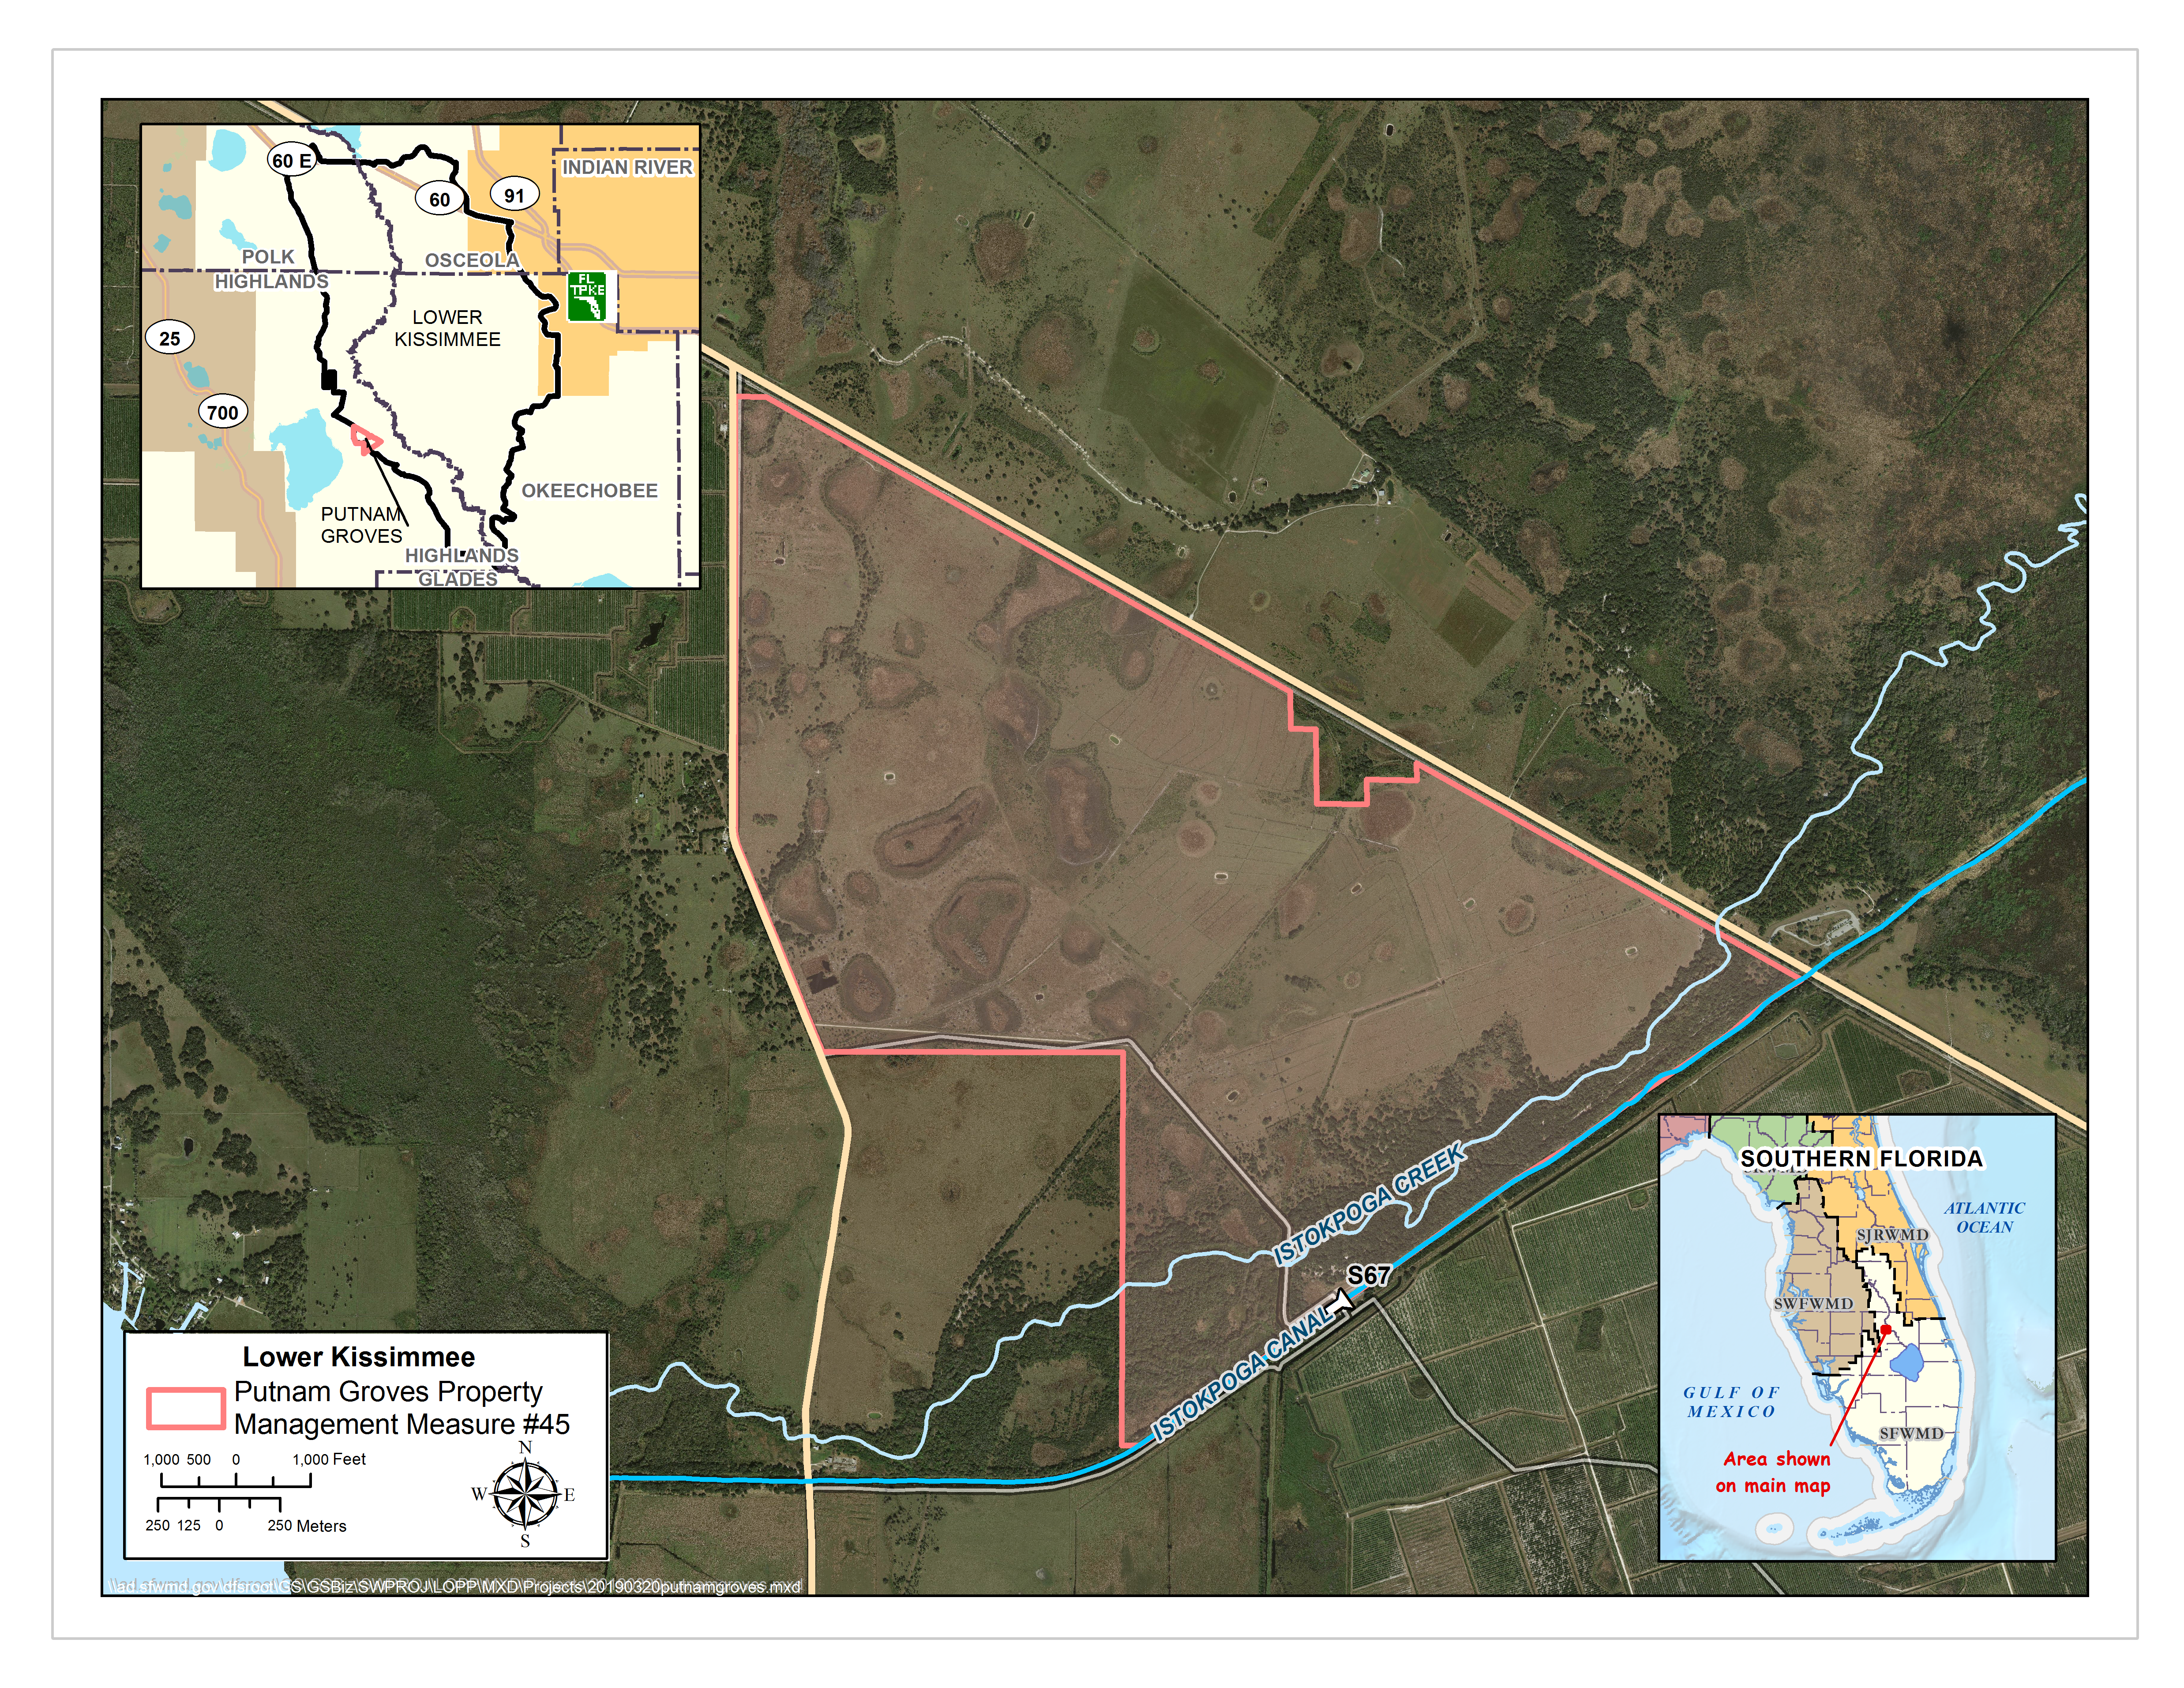
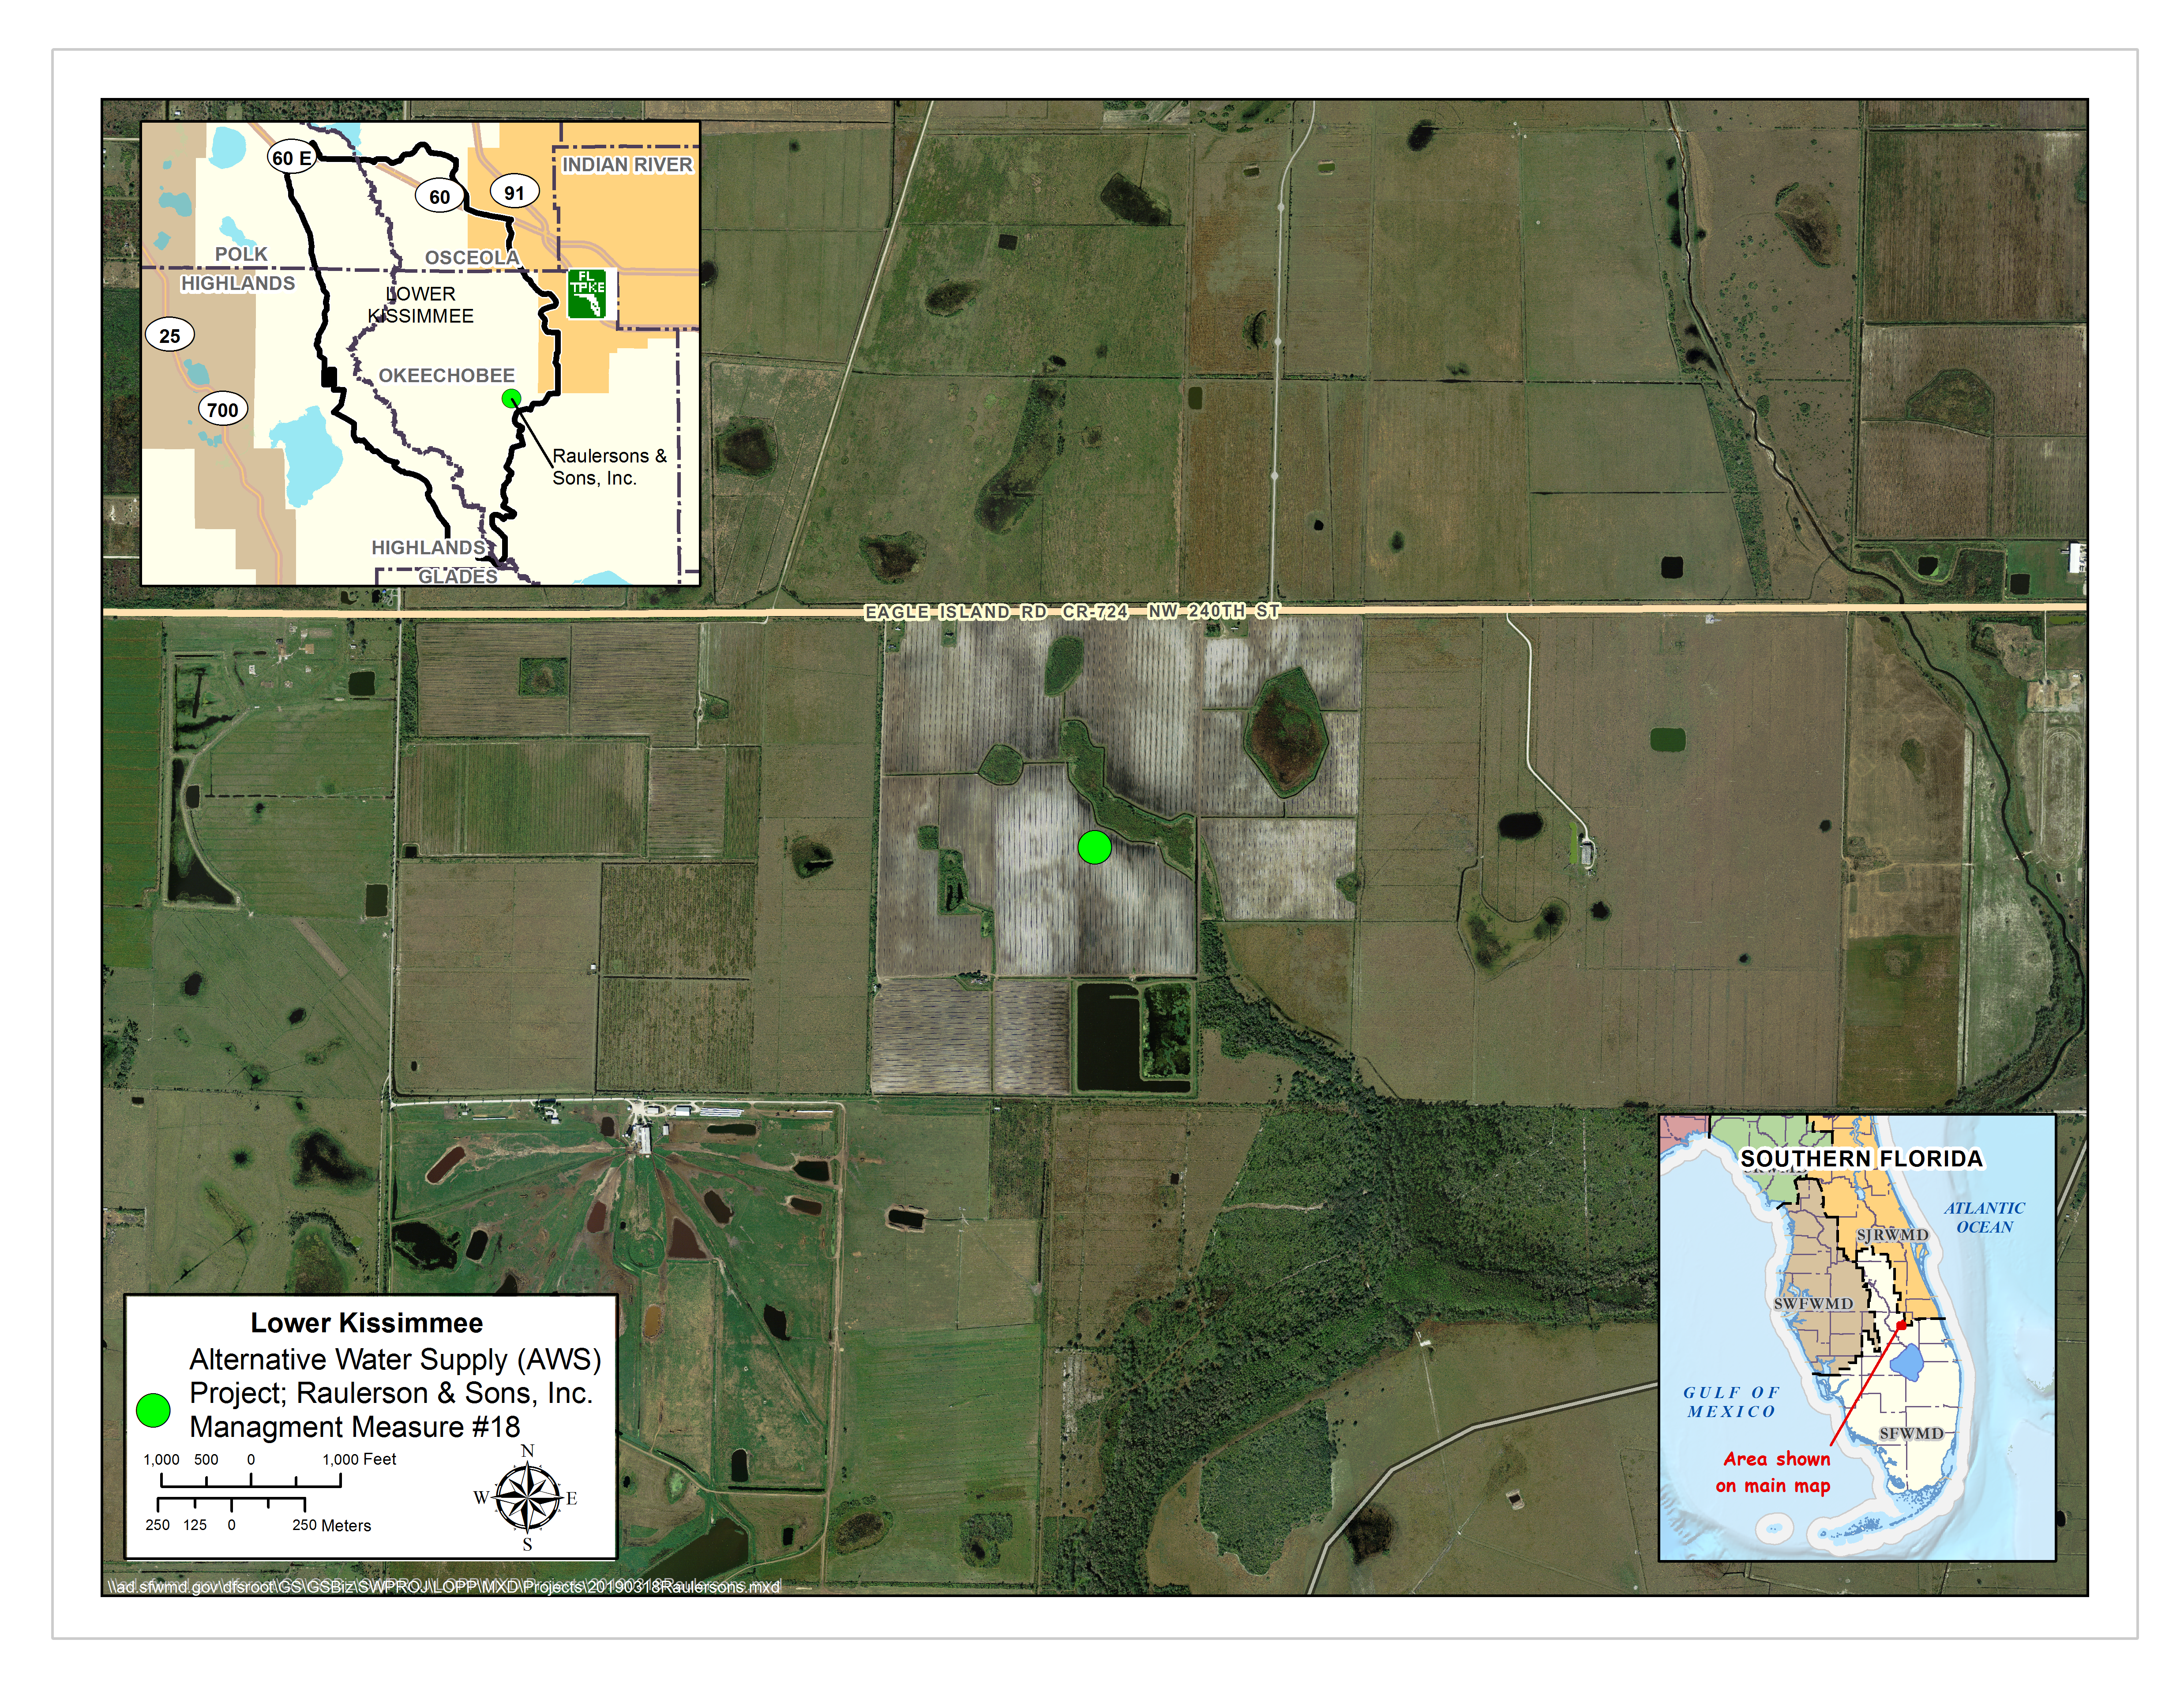 Purpose: Assess, plan, design, and construct water storage/disposal projects on public, private, and tribal lands.
 Purpose: Assess, plan, design, and construct water storage/disposal projects on public, private, and tribal lands.
 Purpose: Assess, plan, design, and construct water storage/disposal projects on public, private, and tribal lands.
 Purpose: Assess, plan, design, and construct water storage/disposal projects on public, private, and tribal lands.
 Purpose: Provide shallow storage, retention and detention to enhance Lake Okeechobee and estuary health by reducing discharge volumes, reducing nutrient loading to downstream receiving waters, and expanding groundwater recharge opportunities.
 Purpose: Utilize interim facilities for water storage by employing a range of site alternative measures at a number of project sites. Alternatives include construction of on-site measures such as temporary ditch blocks, minor berms, minimal earthwork, wetland restoration, and potential water diversions to the project site using temporary pump facilities.
 Purpose: To enhance existing storage capacity in the Lake Okeechobee Watershed.
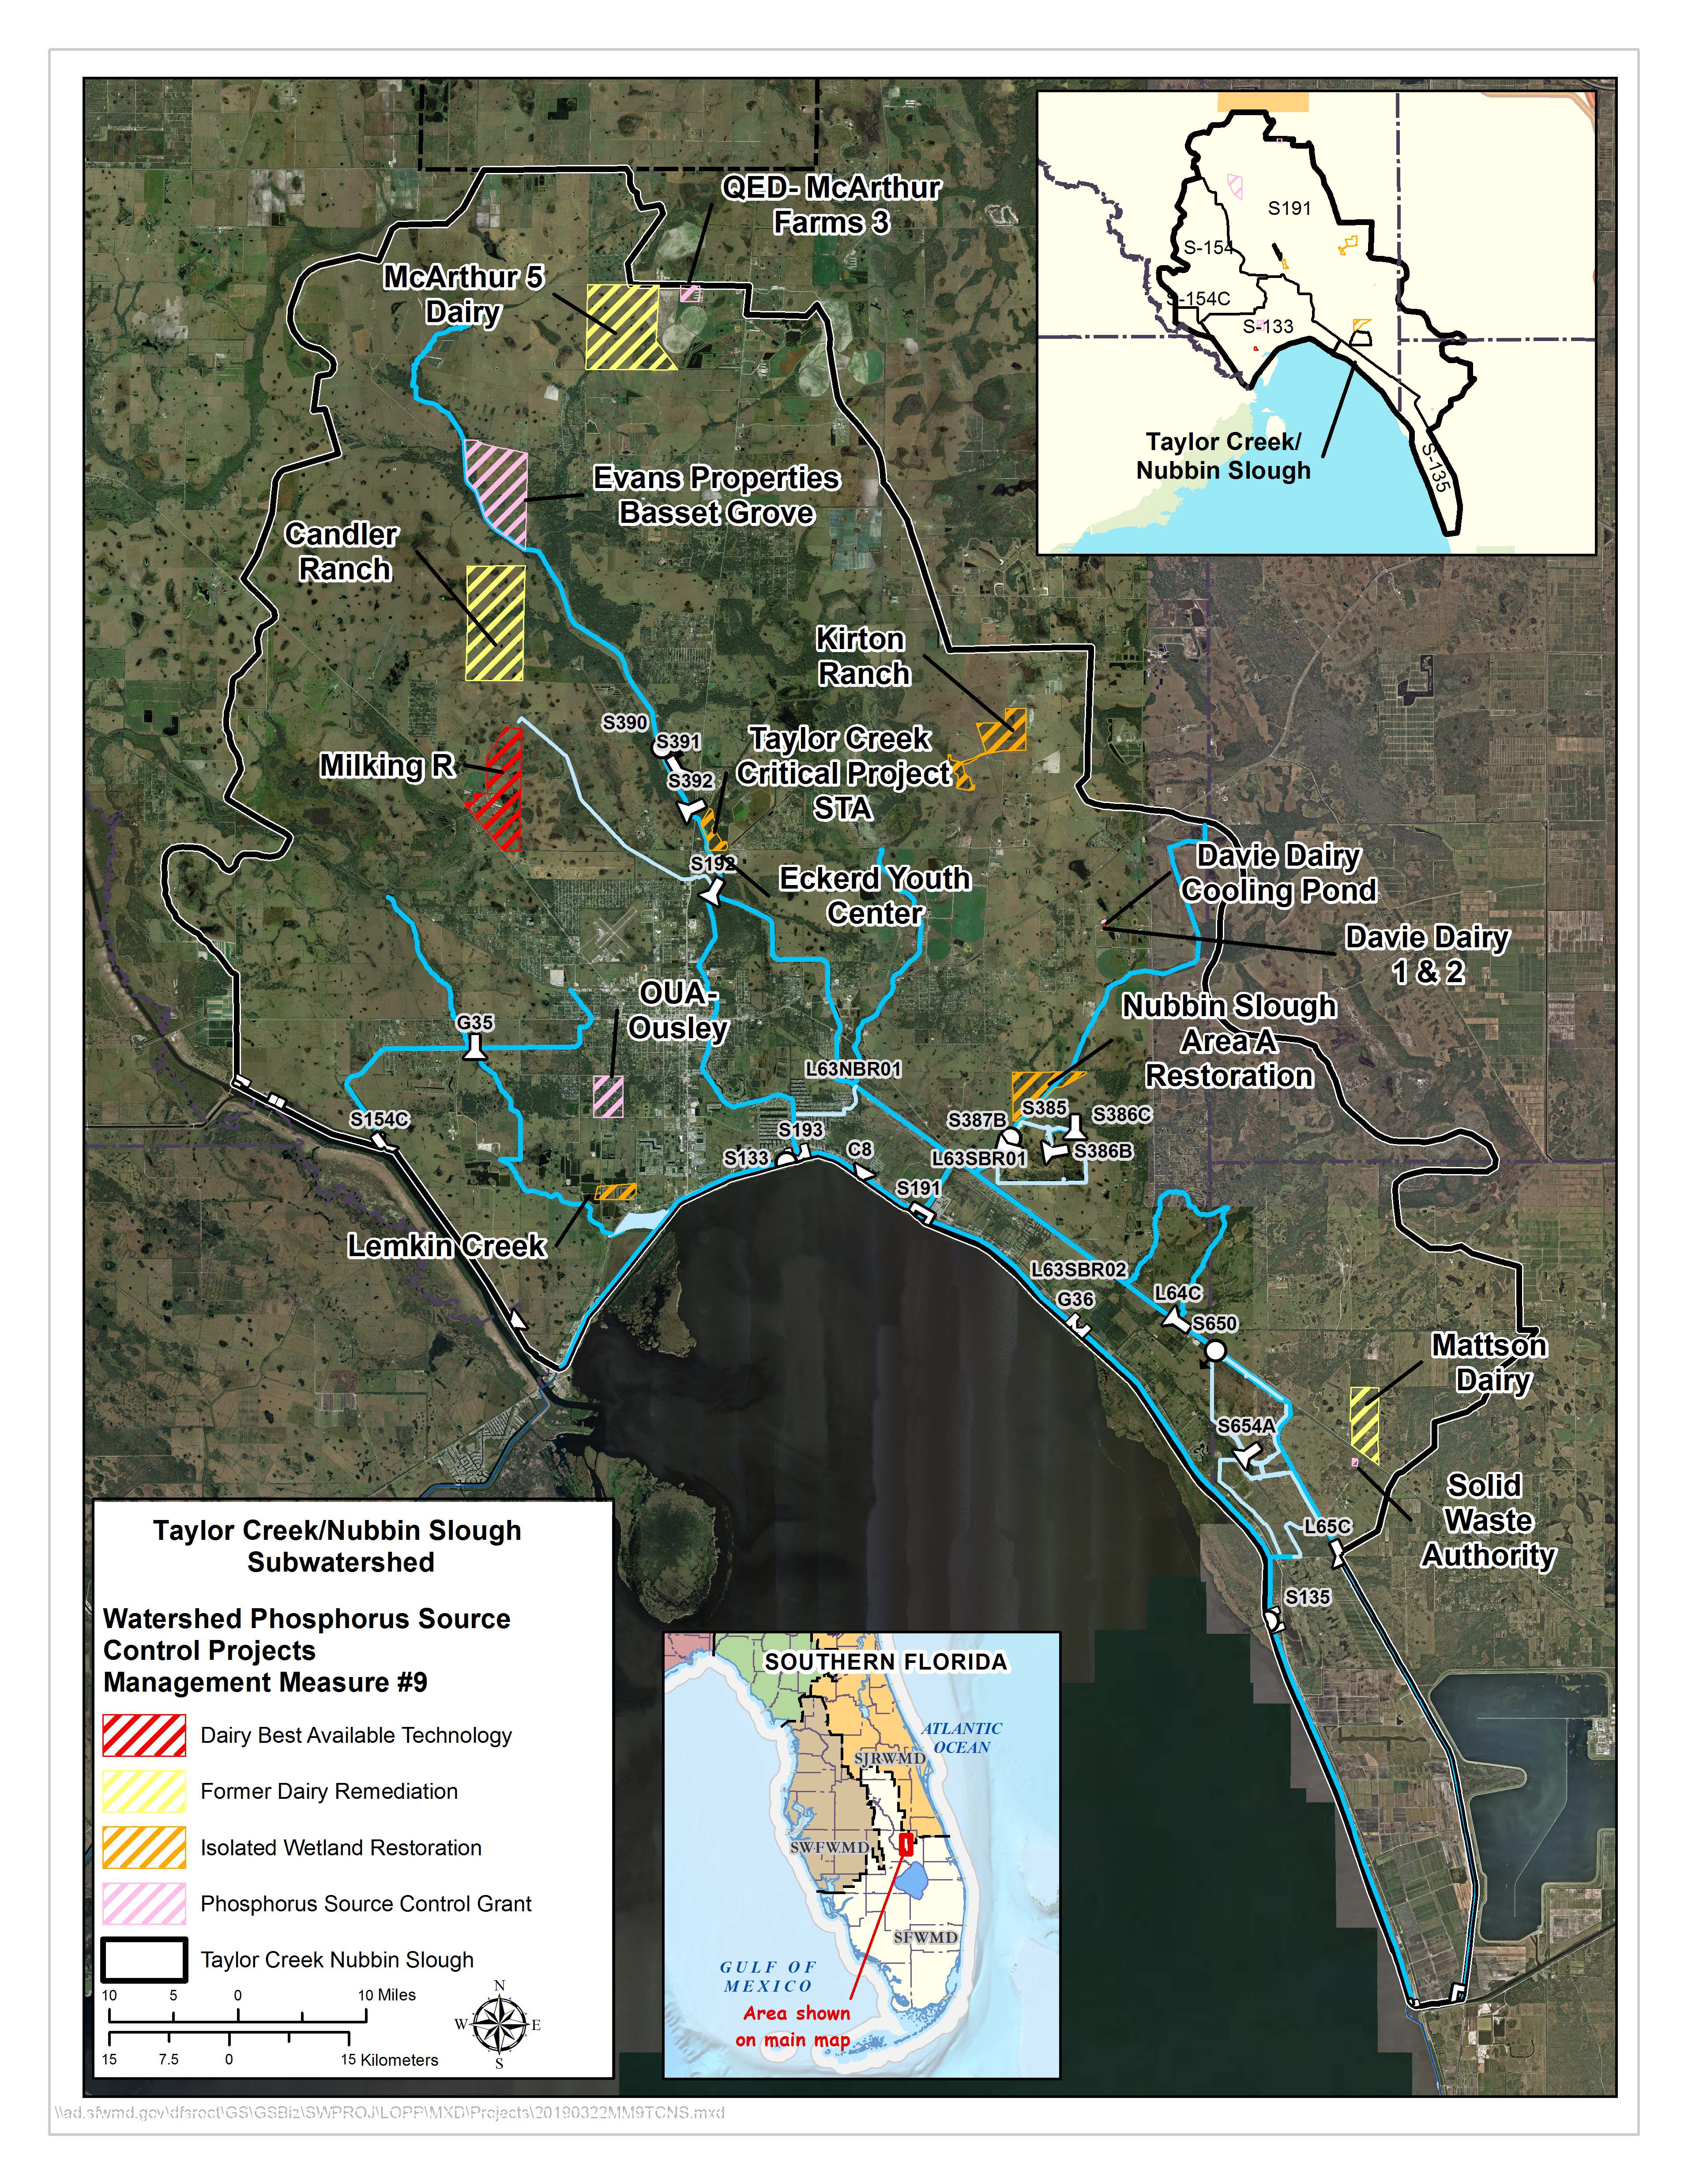
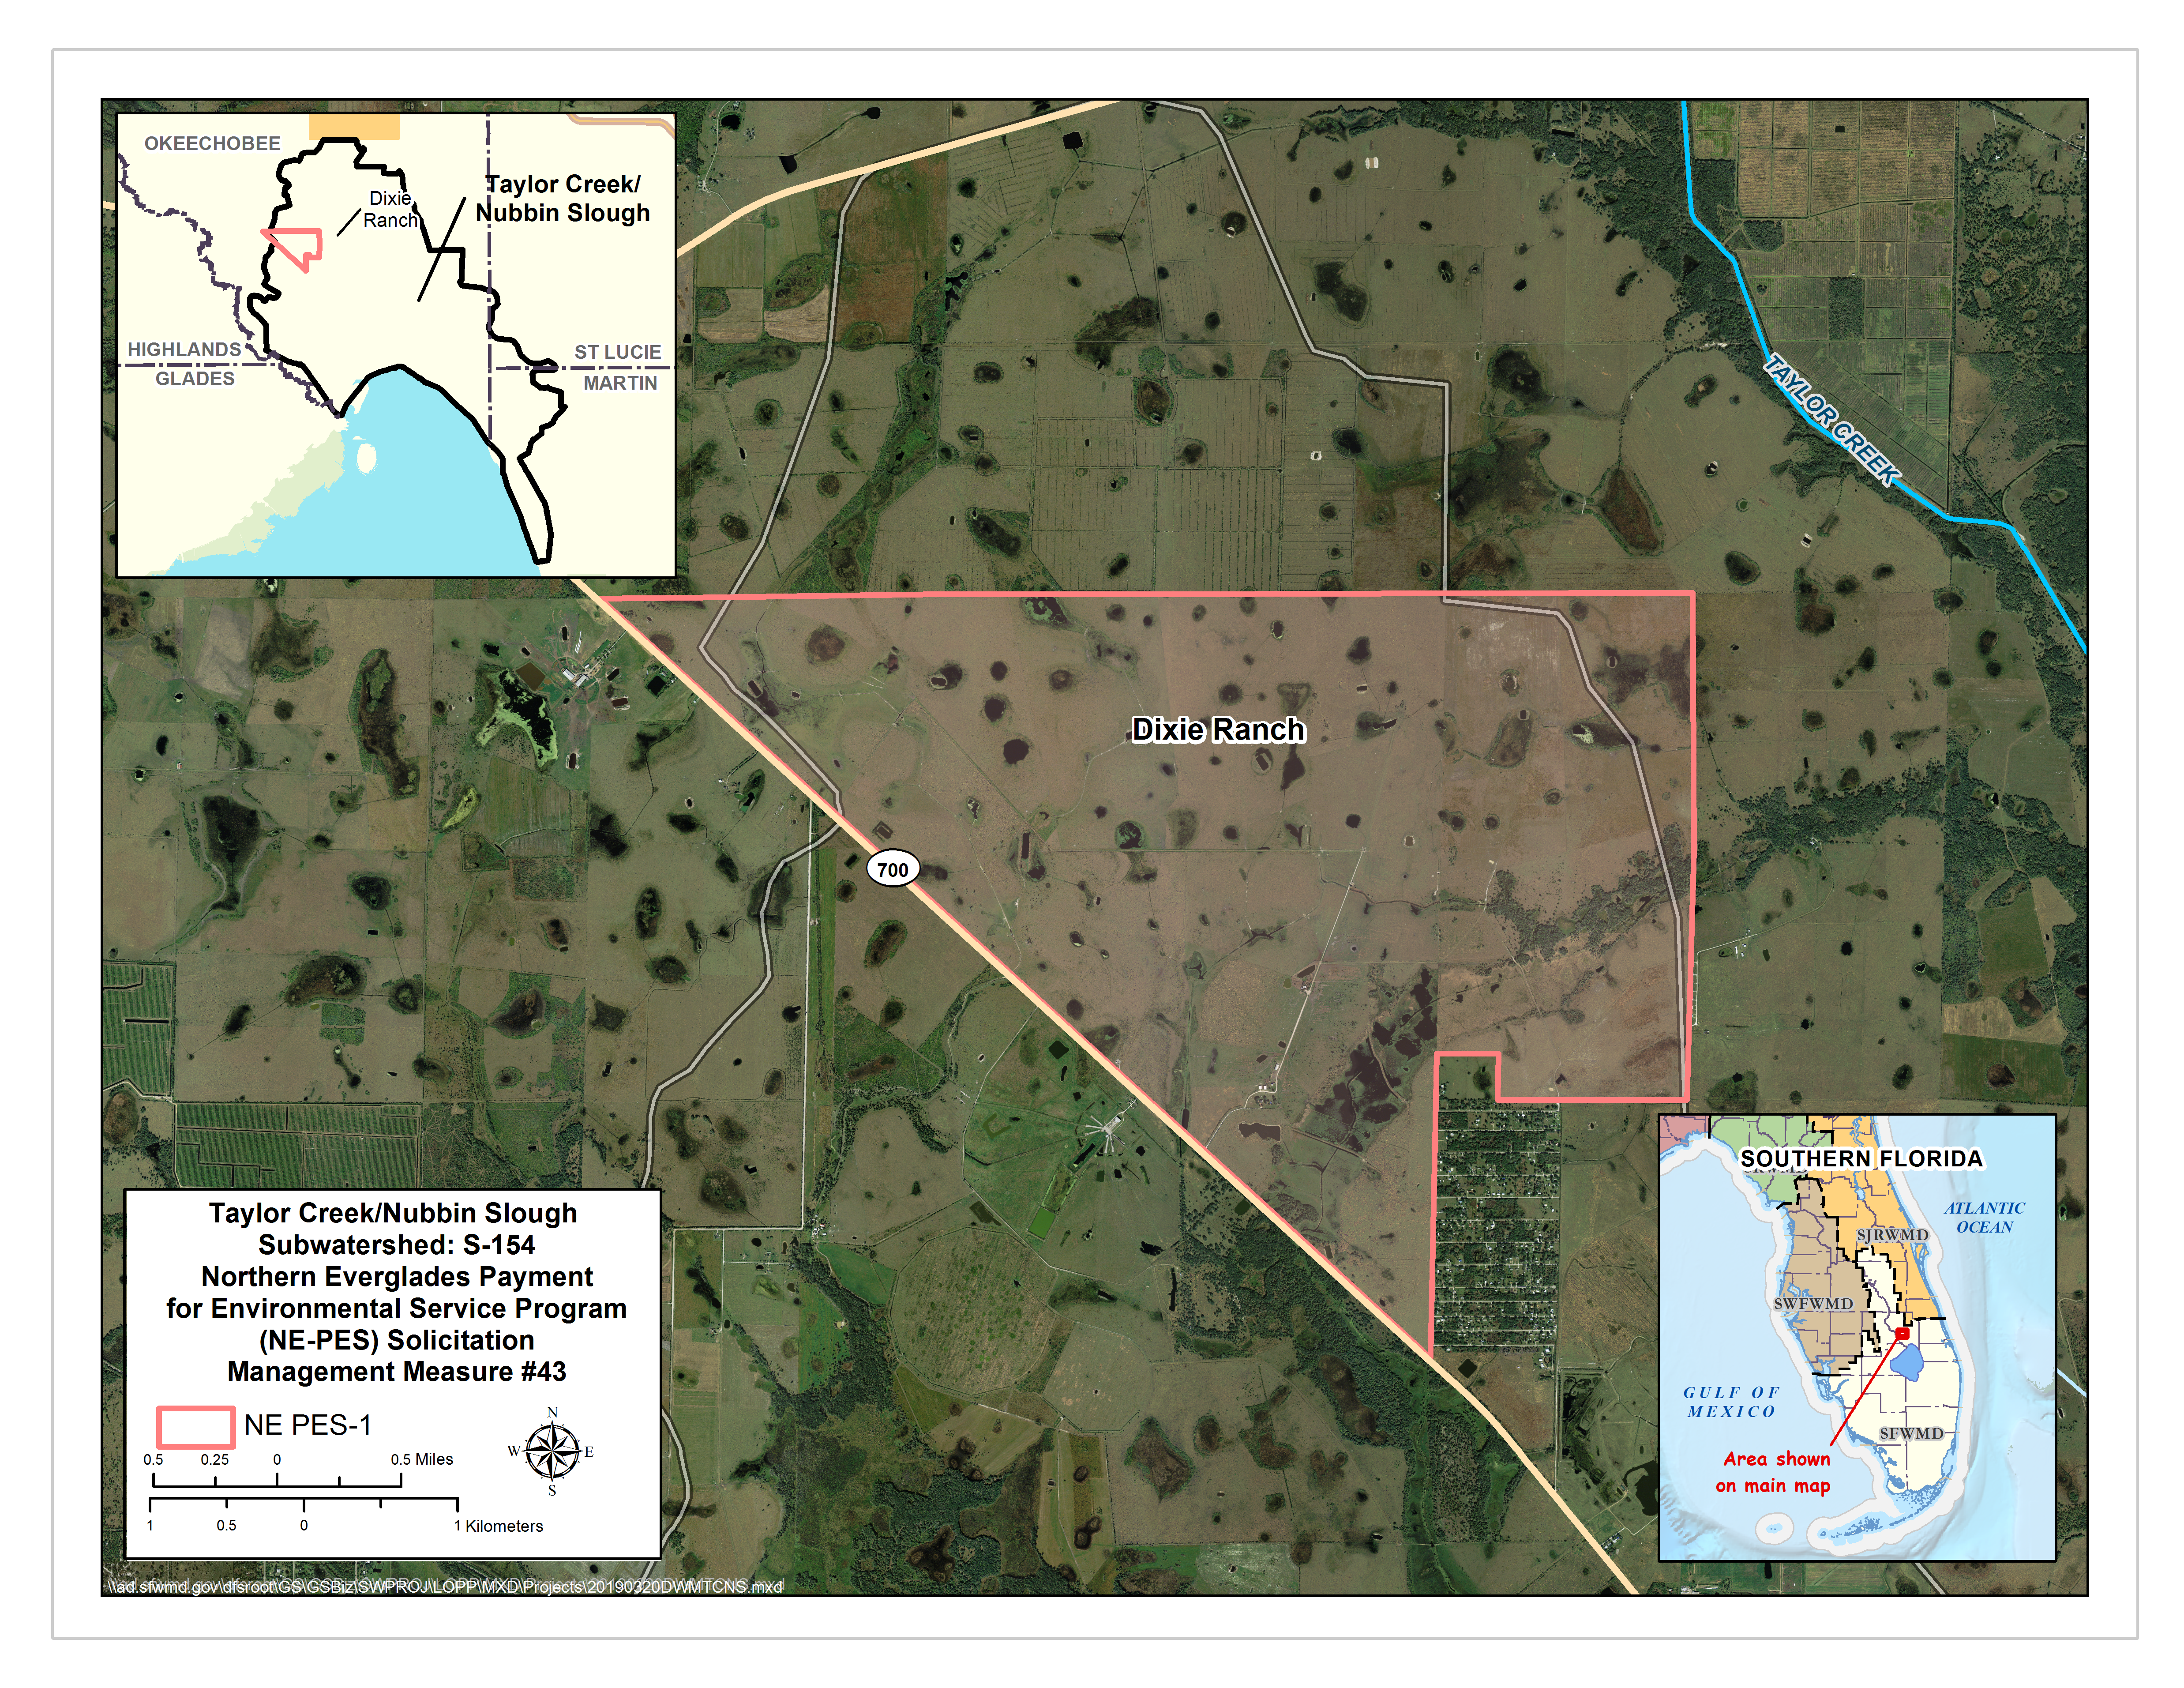
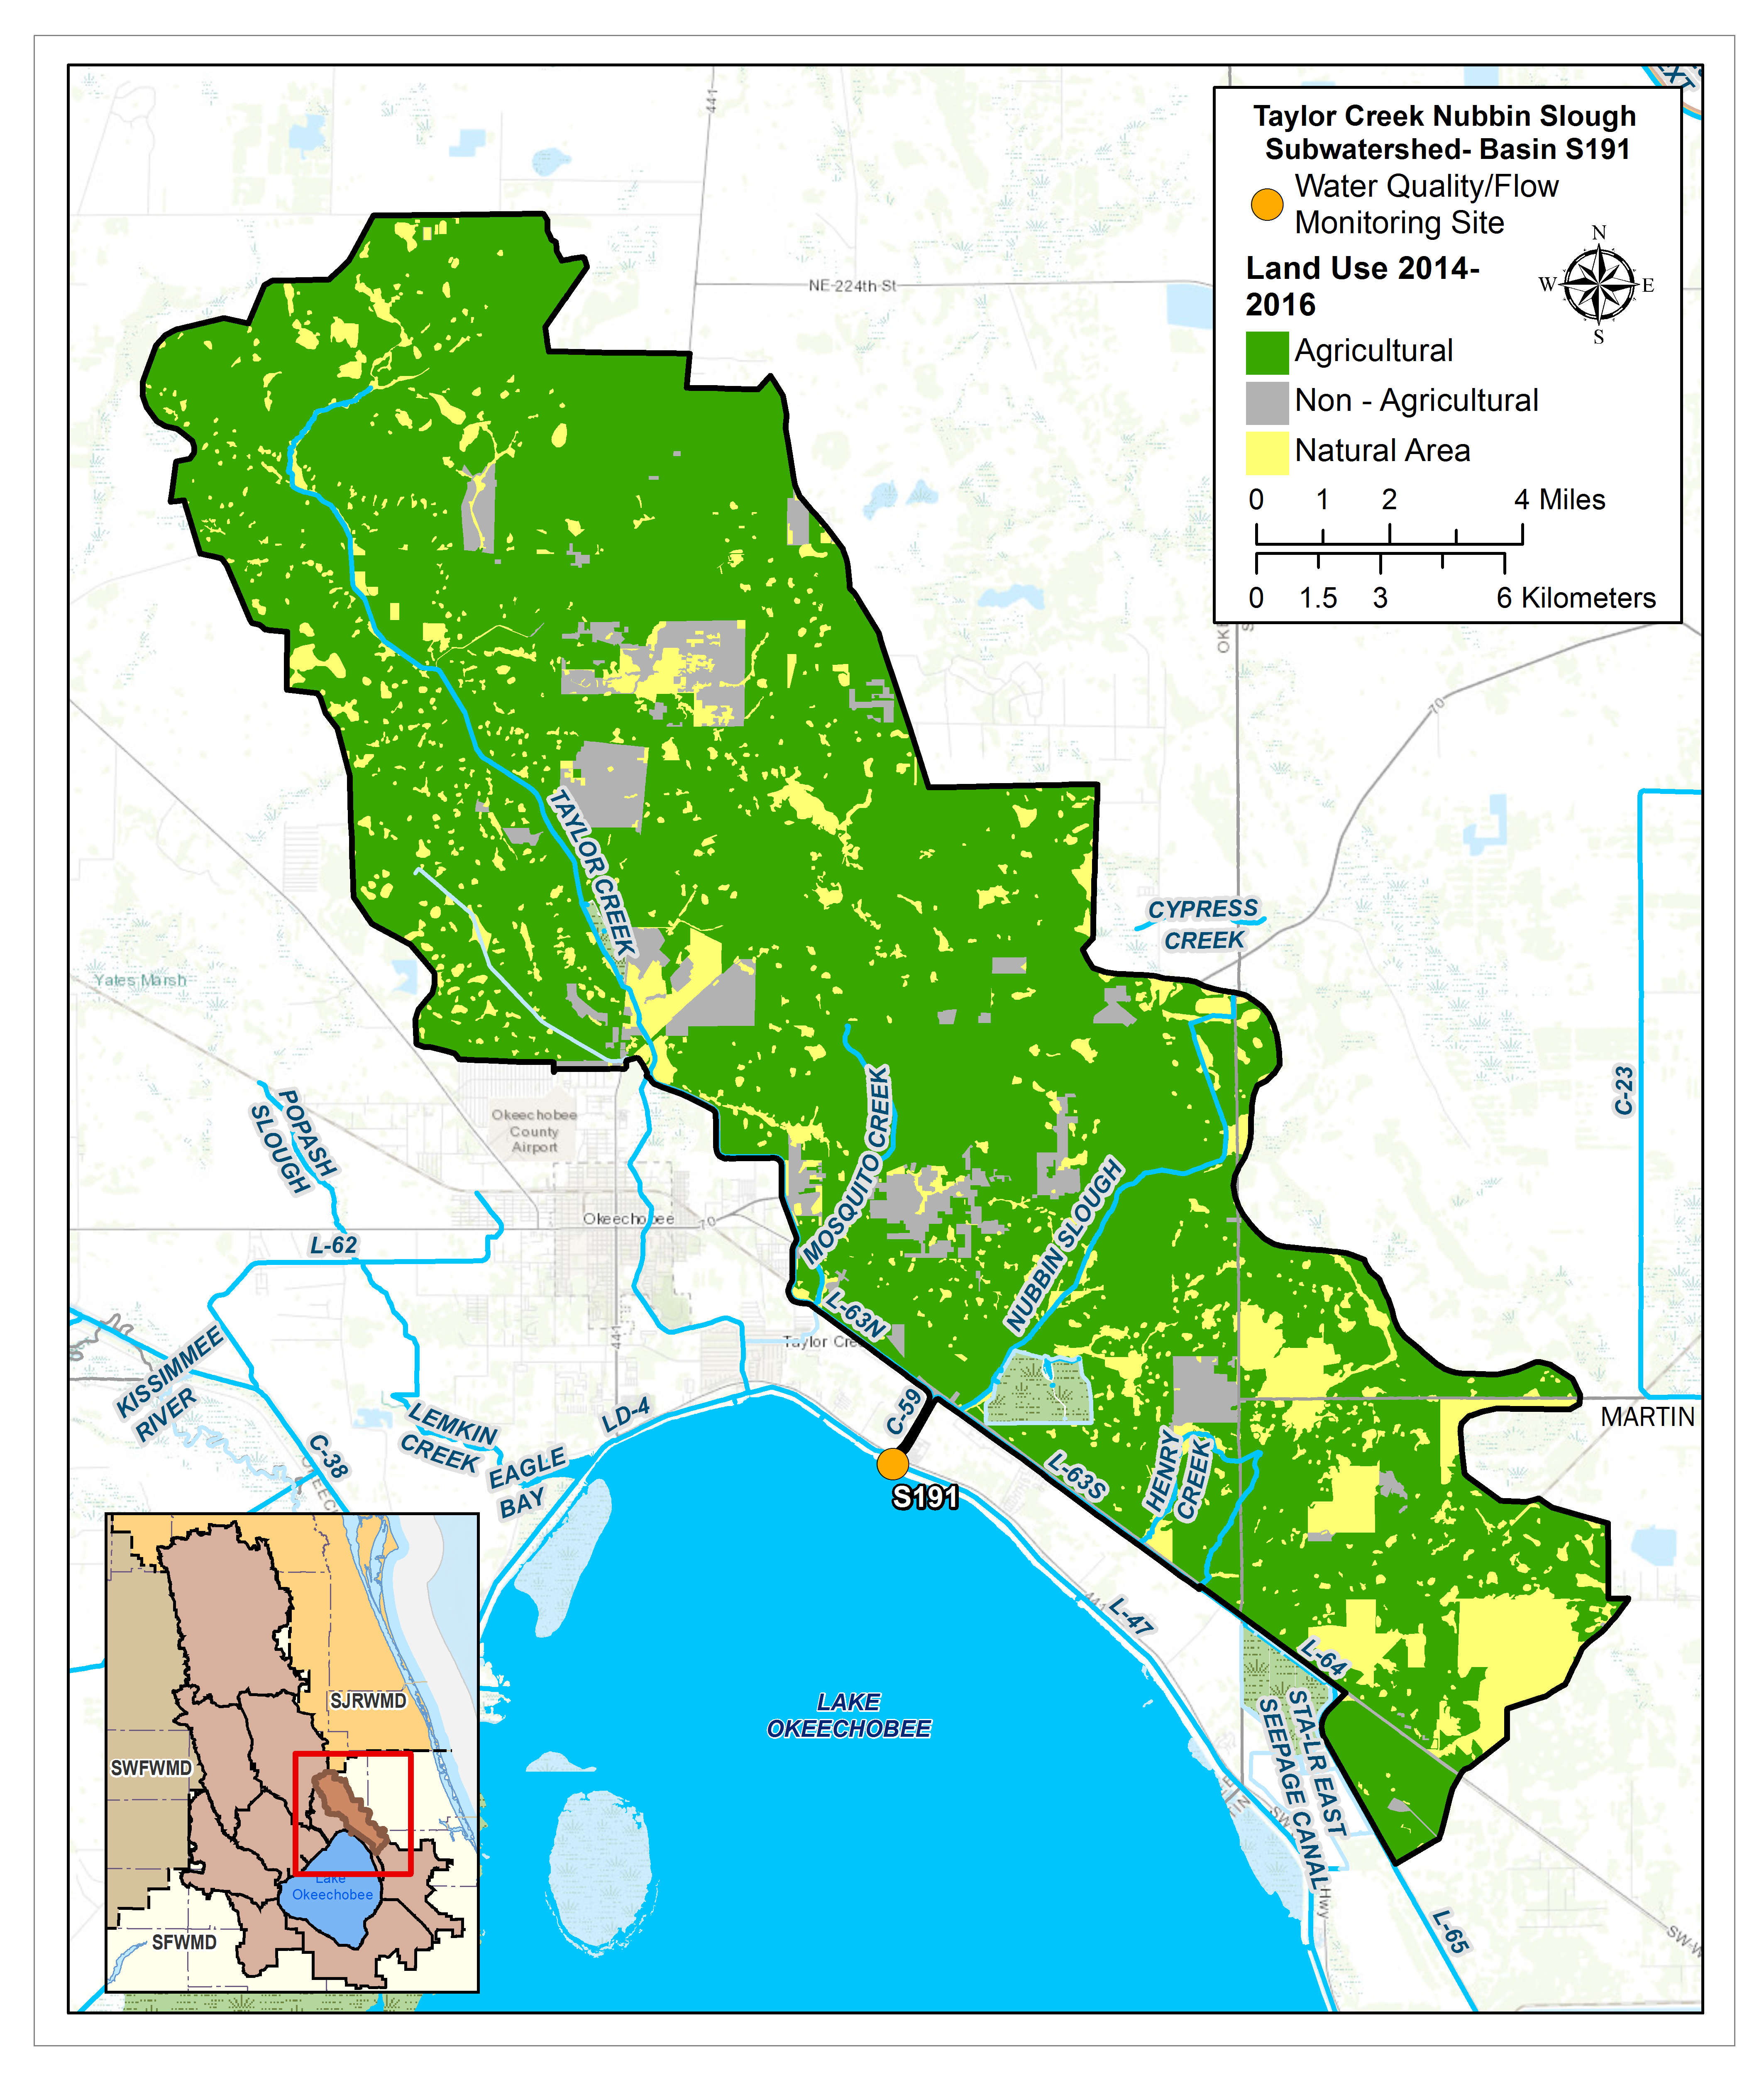
TAYLOR CREEK/NUBBIN SLOUGH BASINS
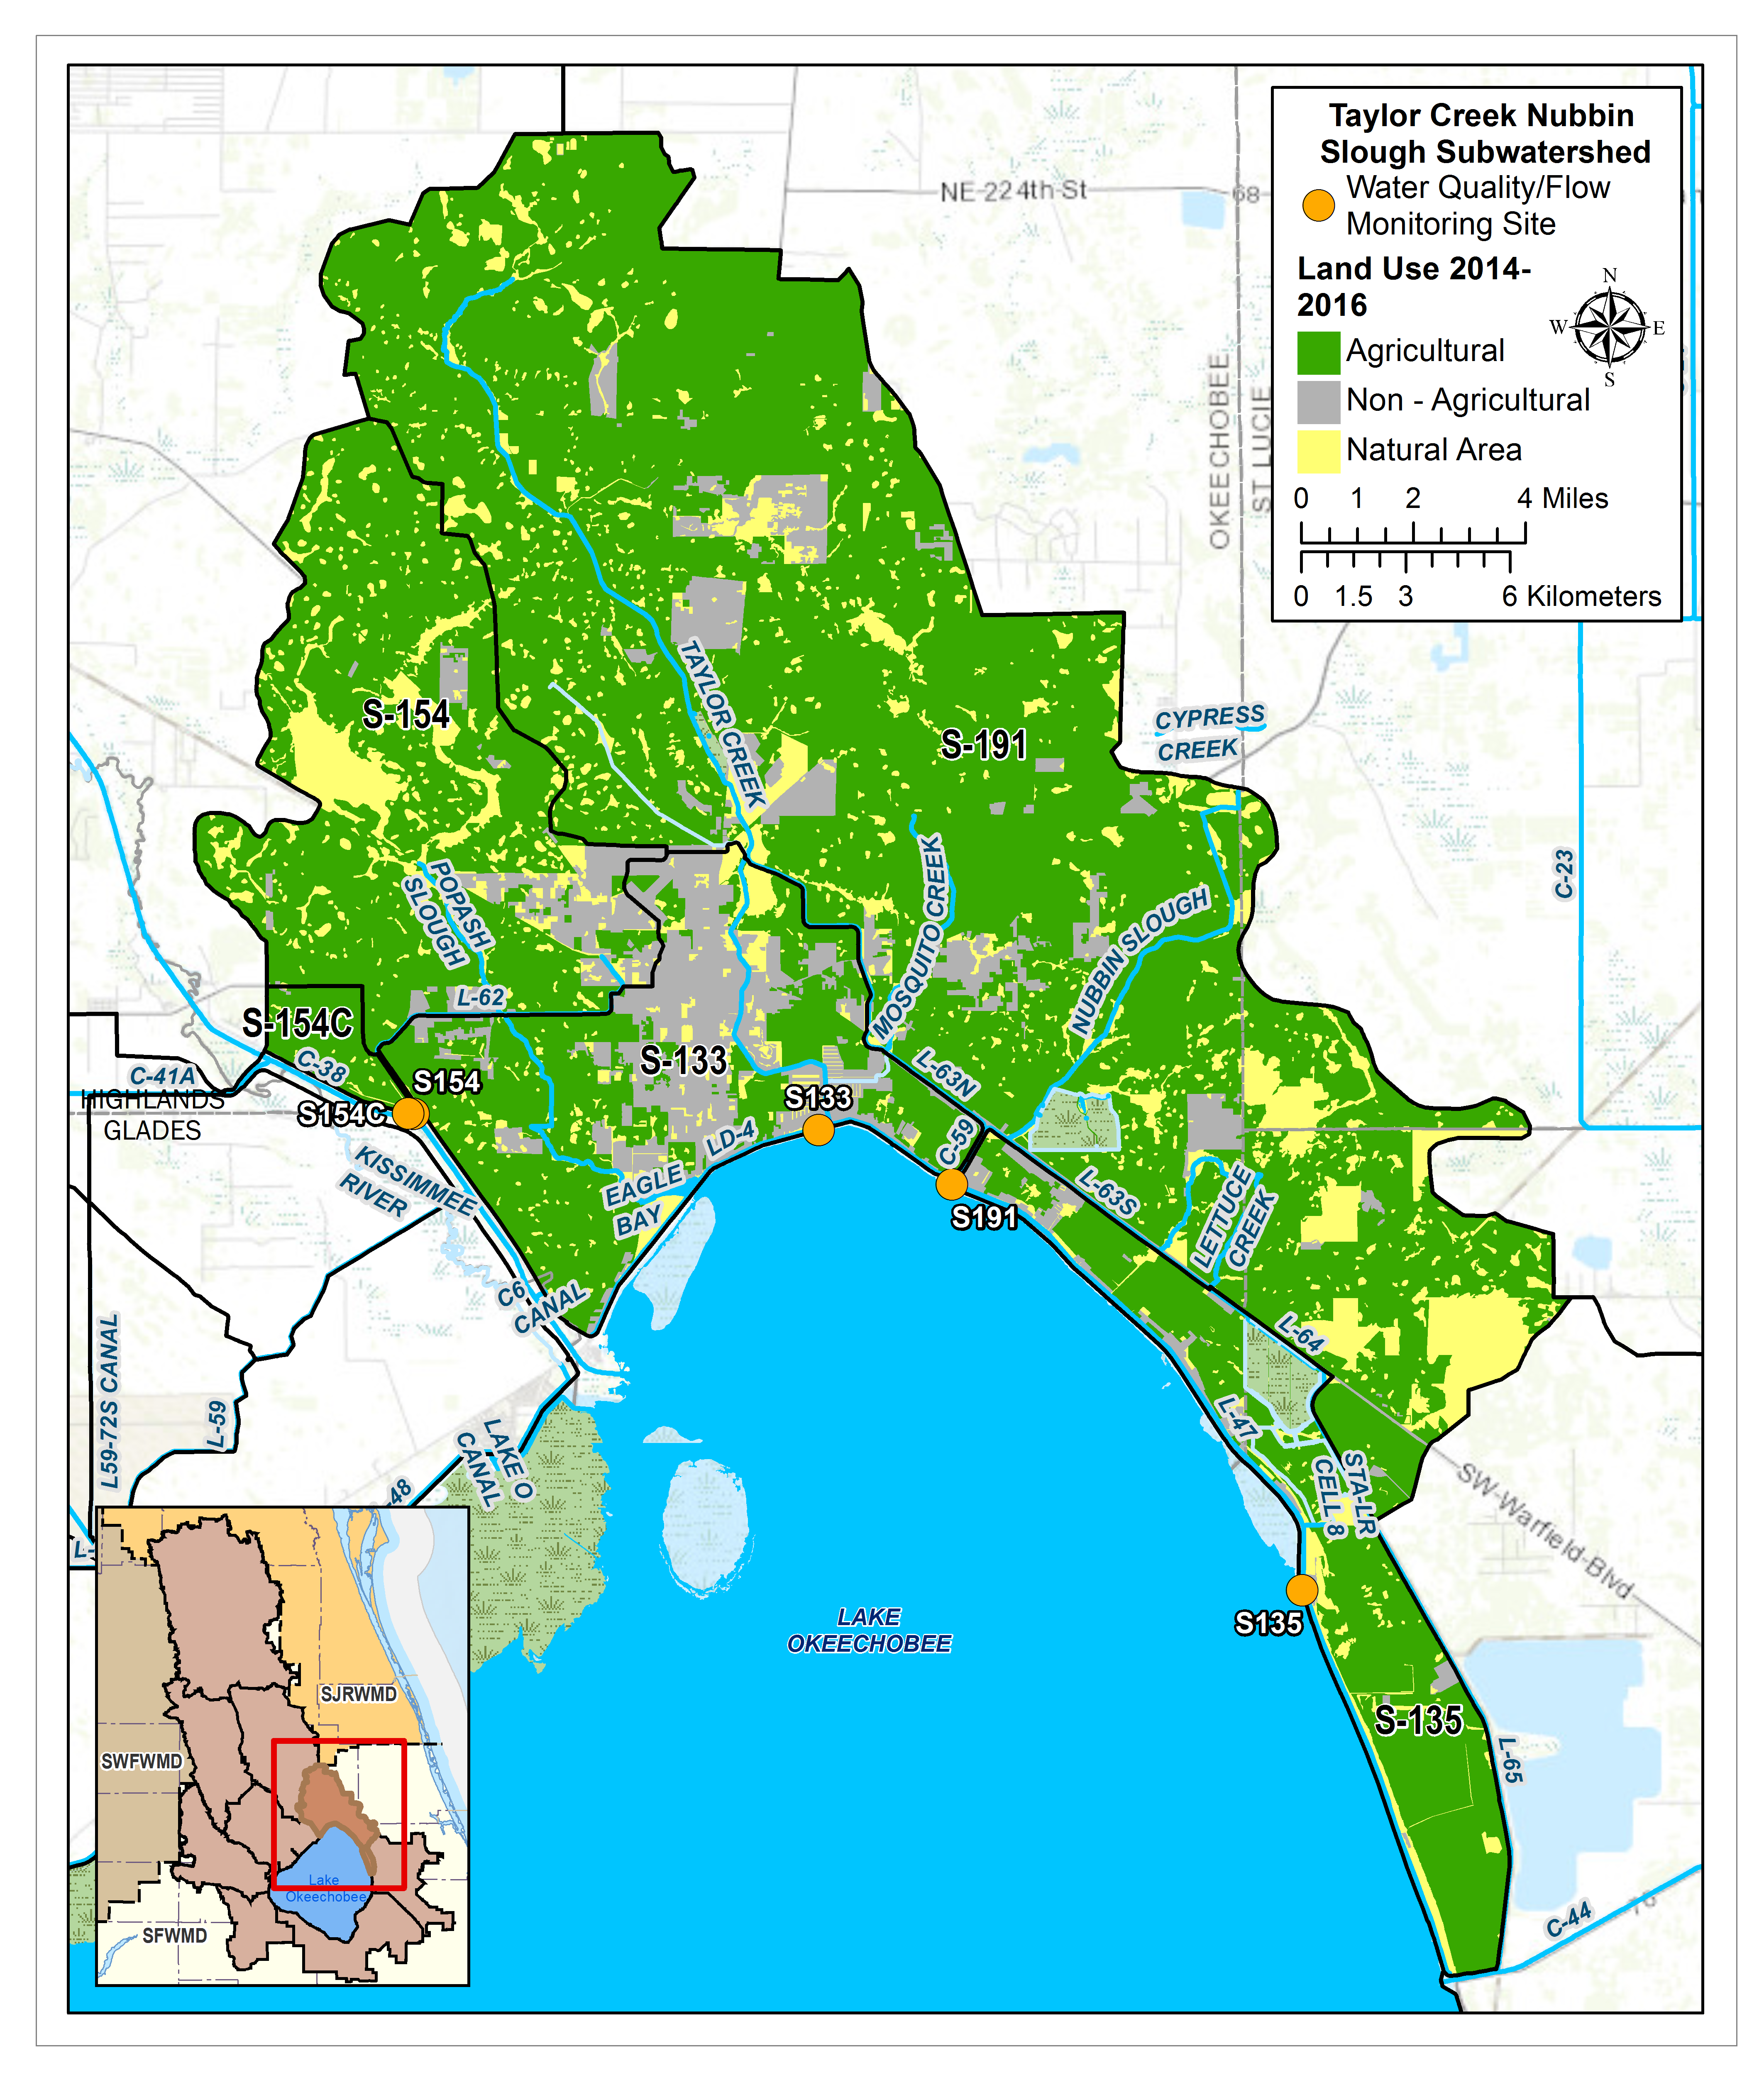
TAYLOR CREEK/NUBBIN SLOUGH SUBWATERSHED
Total Area: 197,795ac
% Area of Lake Okeechobee Watershed: 5.7%
% TP Load of Lake Okeechobee Watershed: 20.0%
Monitoring Locations: S133, S135, S154, S154C, S191
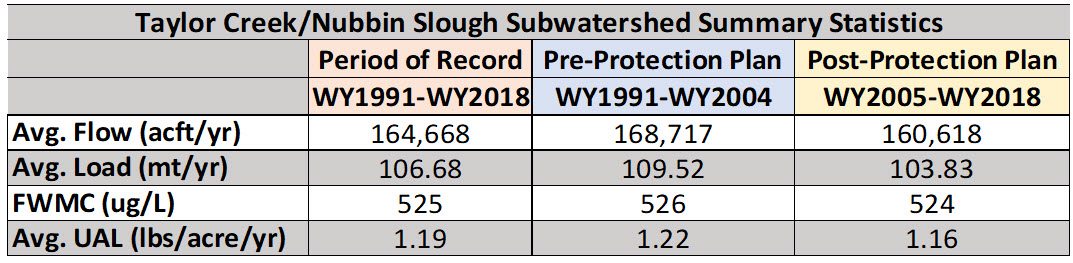
Flow Issues: No
- Flow measurement changes occurred in the S-154C Basin during the pre and post protection plan period.
-
The flows appeared to stay consistent as there was no significant difference between the pre and post protection-plan periods.
-
The basins within this subwatershed are known to have “flashy” runoff volumes.
-
Suggest trying to ease peak flows utilizing existing features to divert a portion of runoff to existing projects.
Water Quality Issues: Yes
-
There is a significant decreasing trend for loads and total phosphorus (TP) flow-weighted mean concentrations (FWMC) for the period of record WY1991-WY2018, but the TP FWMC remain high and TCNS contributes 20% of the total load to lake.
-
This subwatershed has high TP FWMC (524 μg/L during the post-protection plan period) and a high TP unit area load (1.16 lbs/acre during the post-protection plan period) compared to other areas of the Lake Okeechobee Watershed.
.
>>Additional Technical Information
PROJECTS LOCATED IN THIS SUBWATERSHED
 Purpose: Utilize interim facilities for water storage by employing a range of site alternative measures at a number of project sites. Alternatives include construction of on-site measures such as temporary ditch blocks, minor berms, minimal earthwork, wetland restoration, and potential water diversions to the project site using temporary pump facilities.
 Purpose: Acquire 1,000 acres of land to implement a stormwater conveyance system with retention and treatment components from east to west through the City of Okeechobee and Okeechobee County. Following water quality treatment and storage, the water will be conveyed into SFWMD Lemkin Creek urban water storage and treatment facility before making its way into the Rim Canal and ultimately Lake Okeechobee.
 Purpose: Reduce phosphorus exports to Lake Okeechobee in the four priority basins (S-65D, S-65E, S-154, and S-191).
 Purpose: Reduce phosphorus exports to Lake Okeechobee in the four priority basins(S-65D,S-65E,S-154,andS-191).
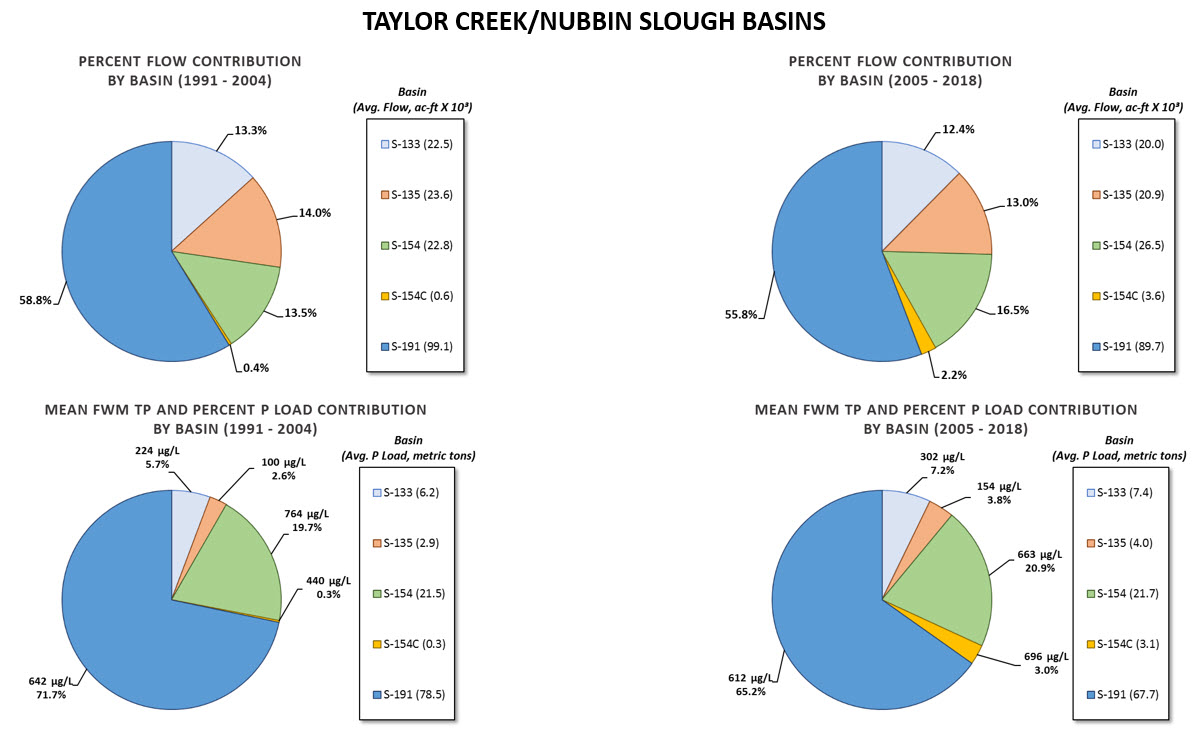
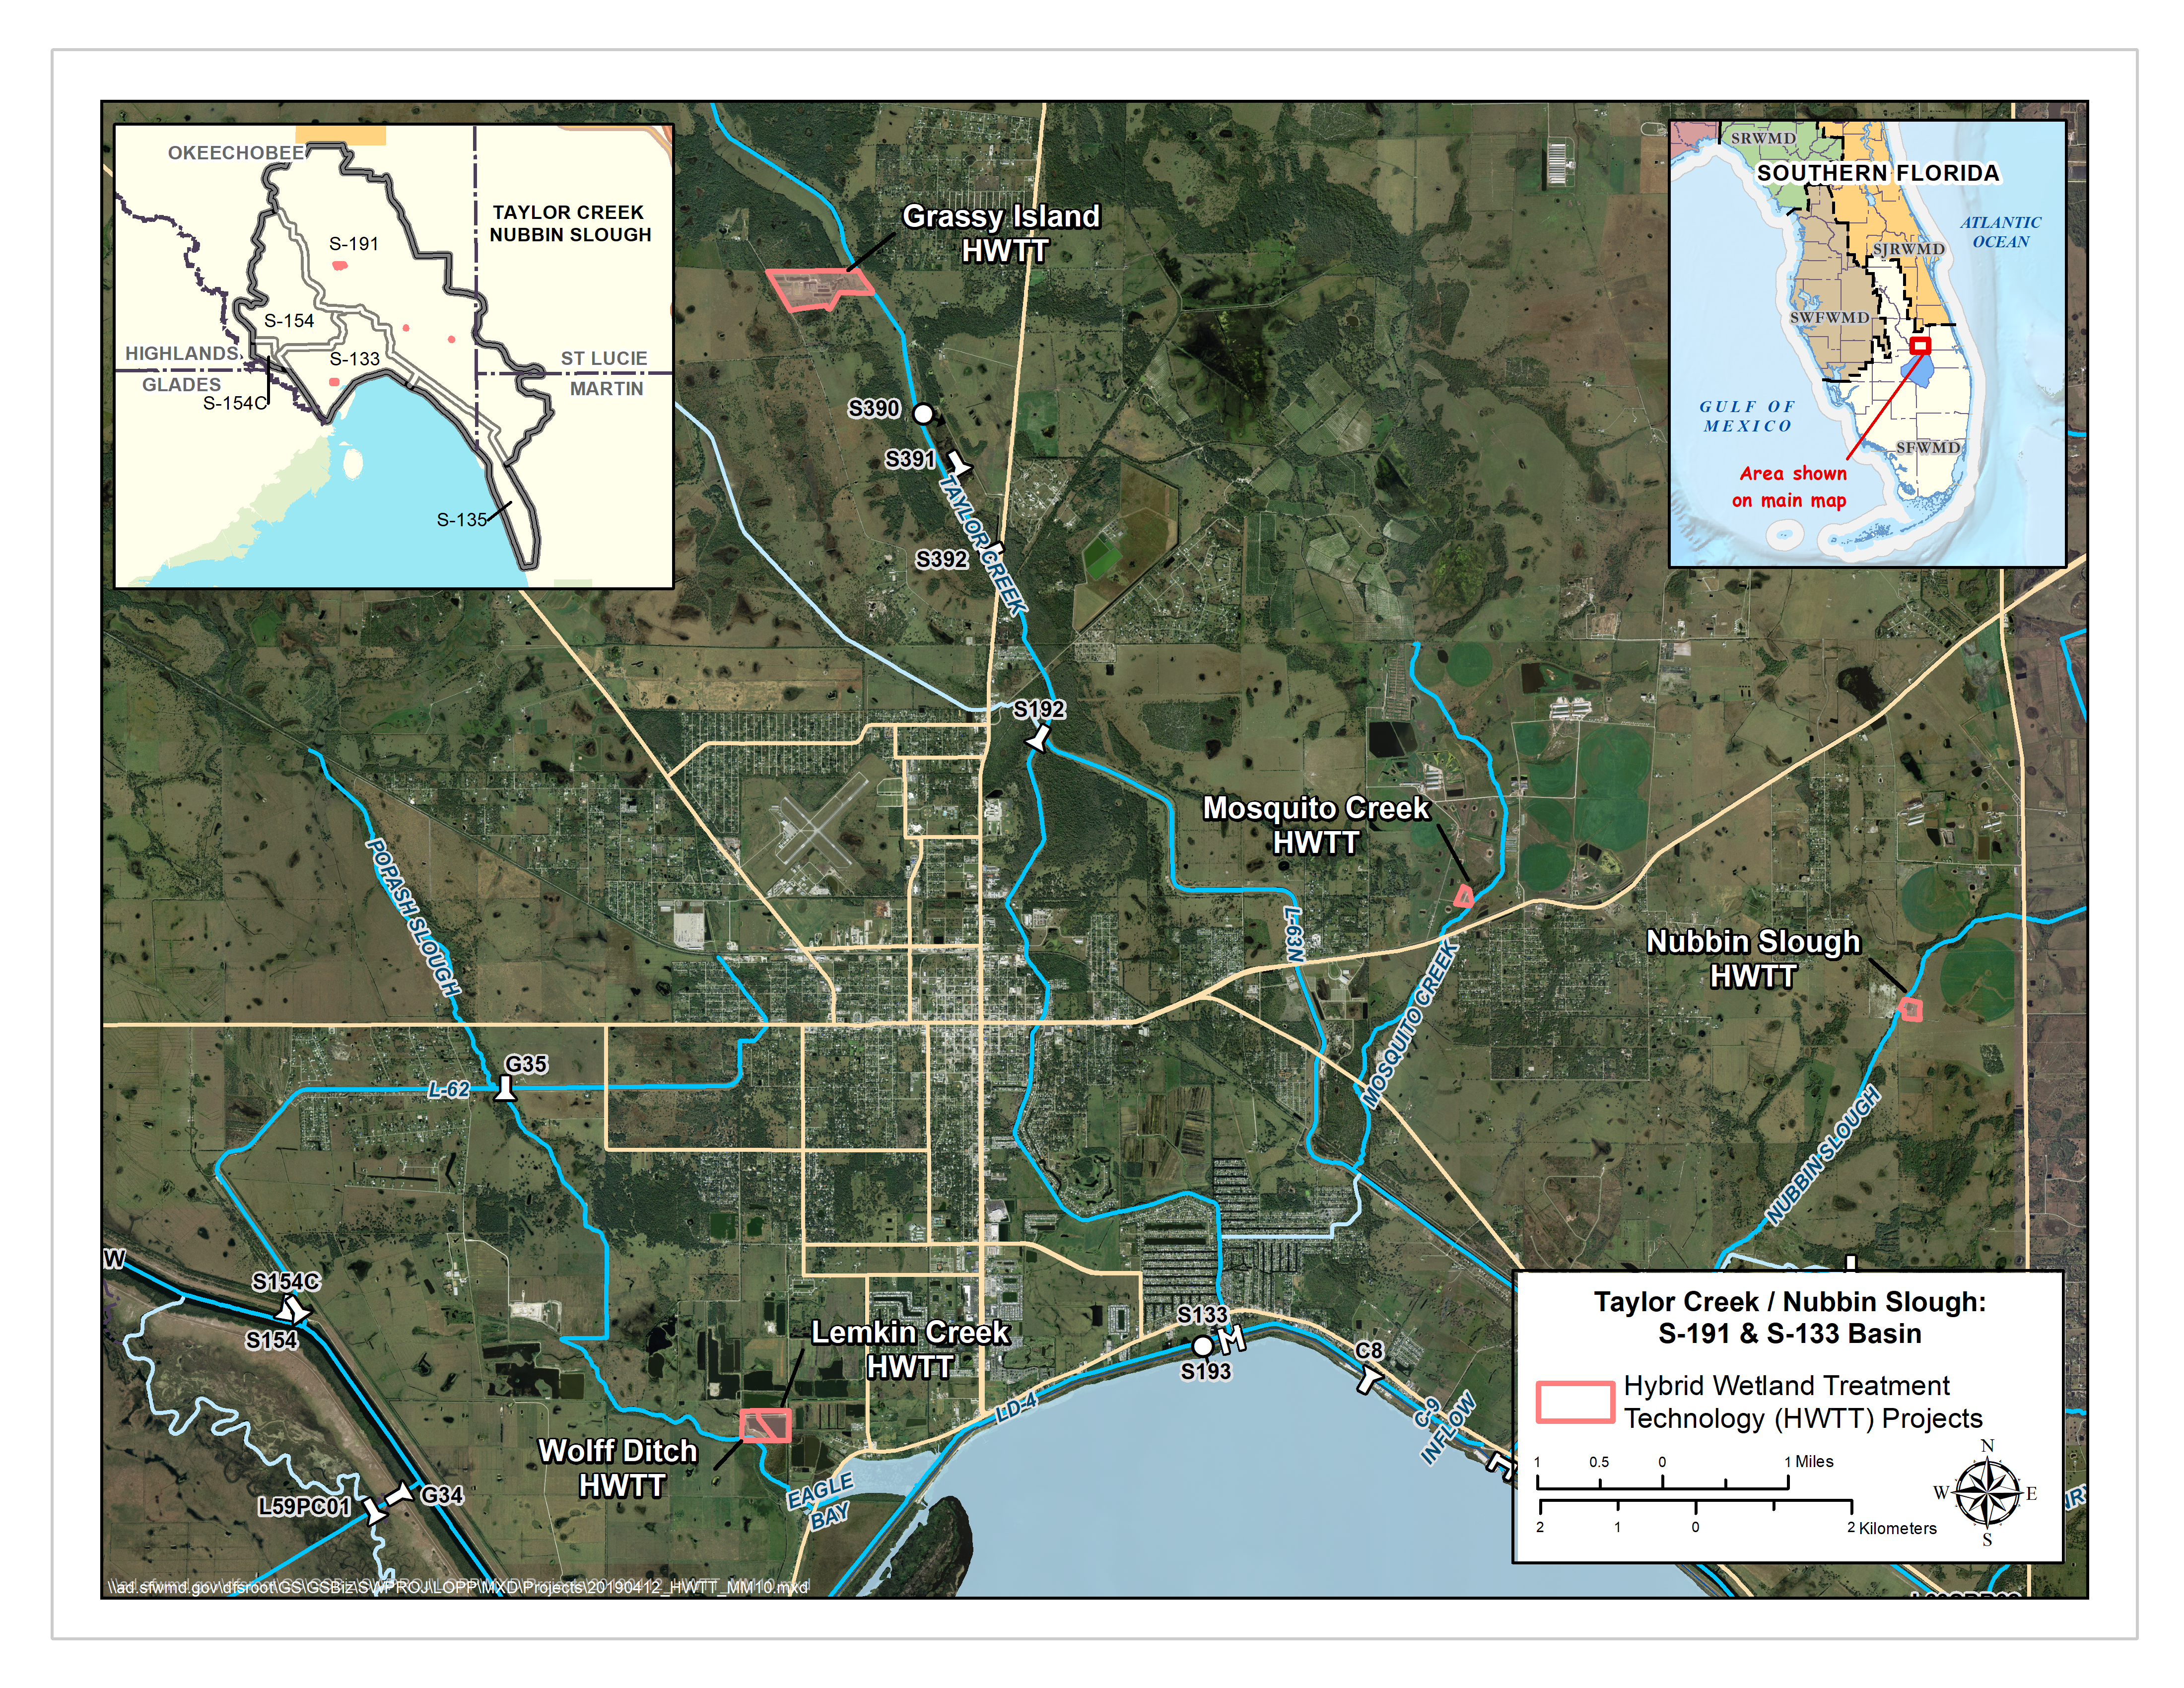
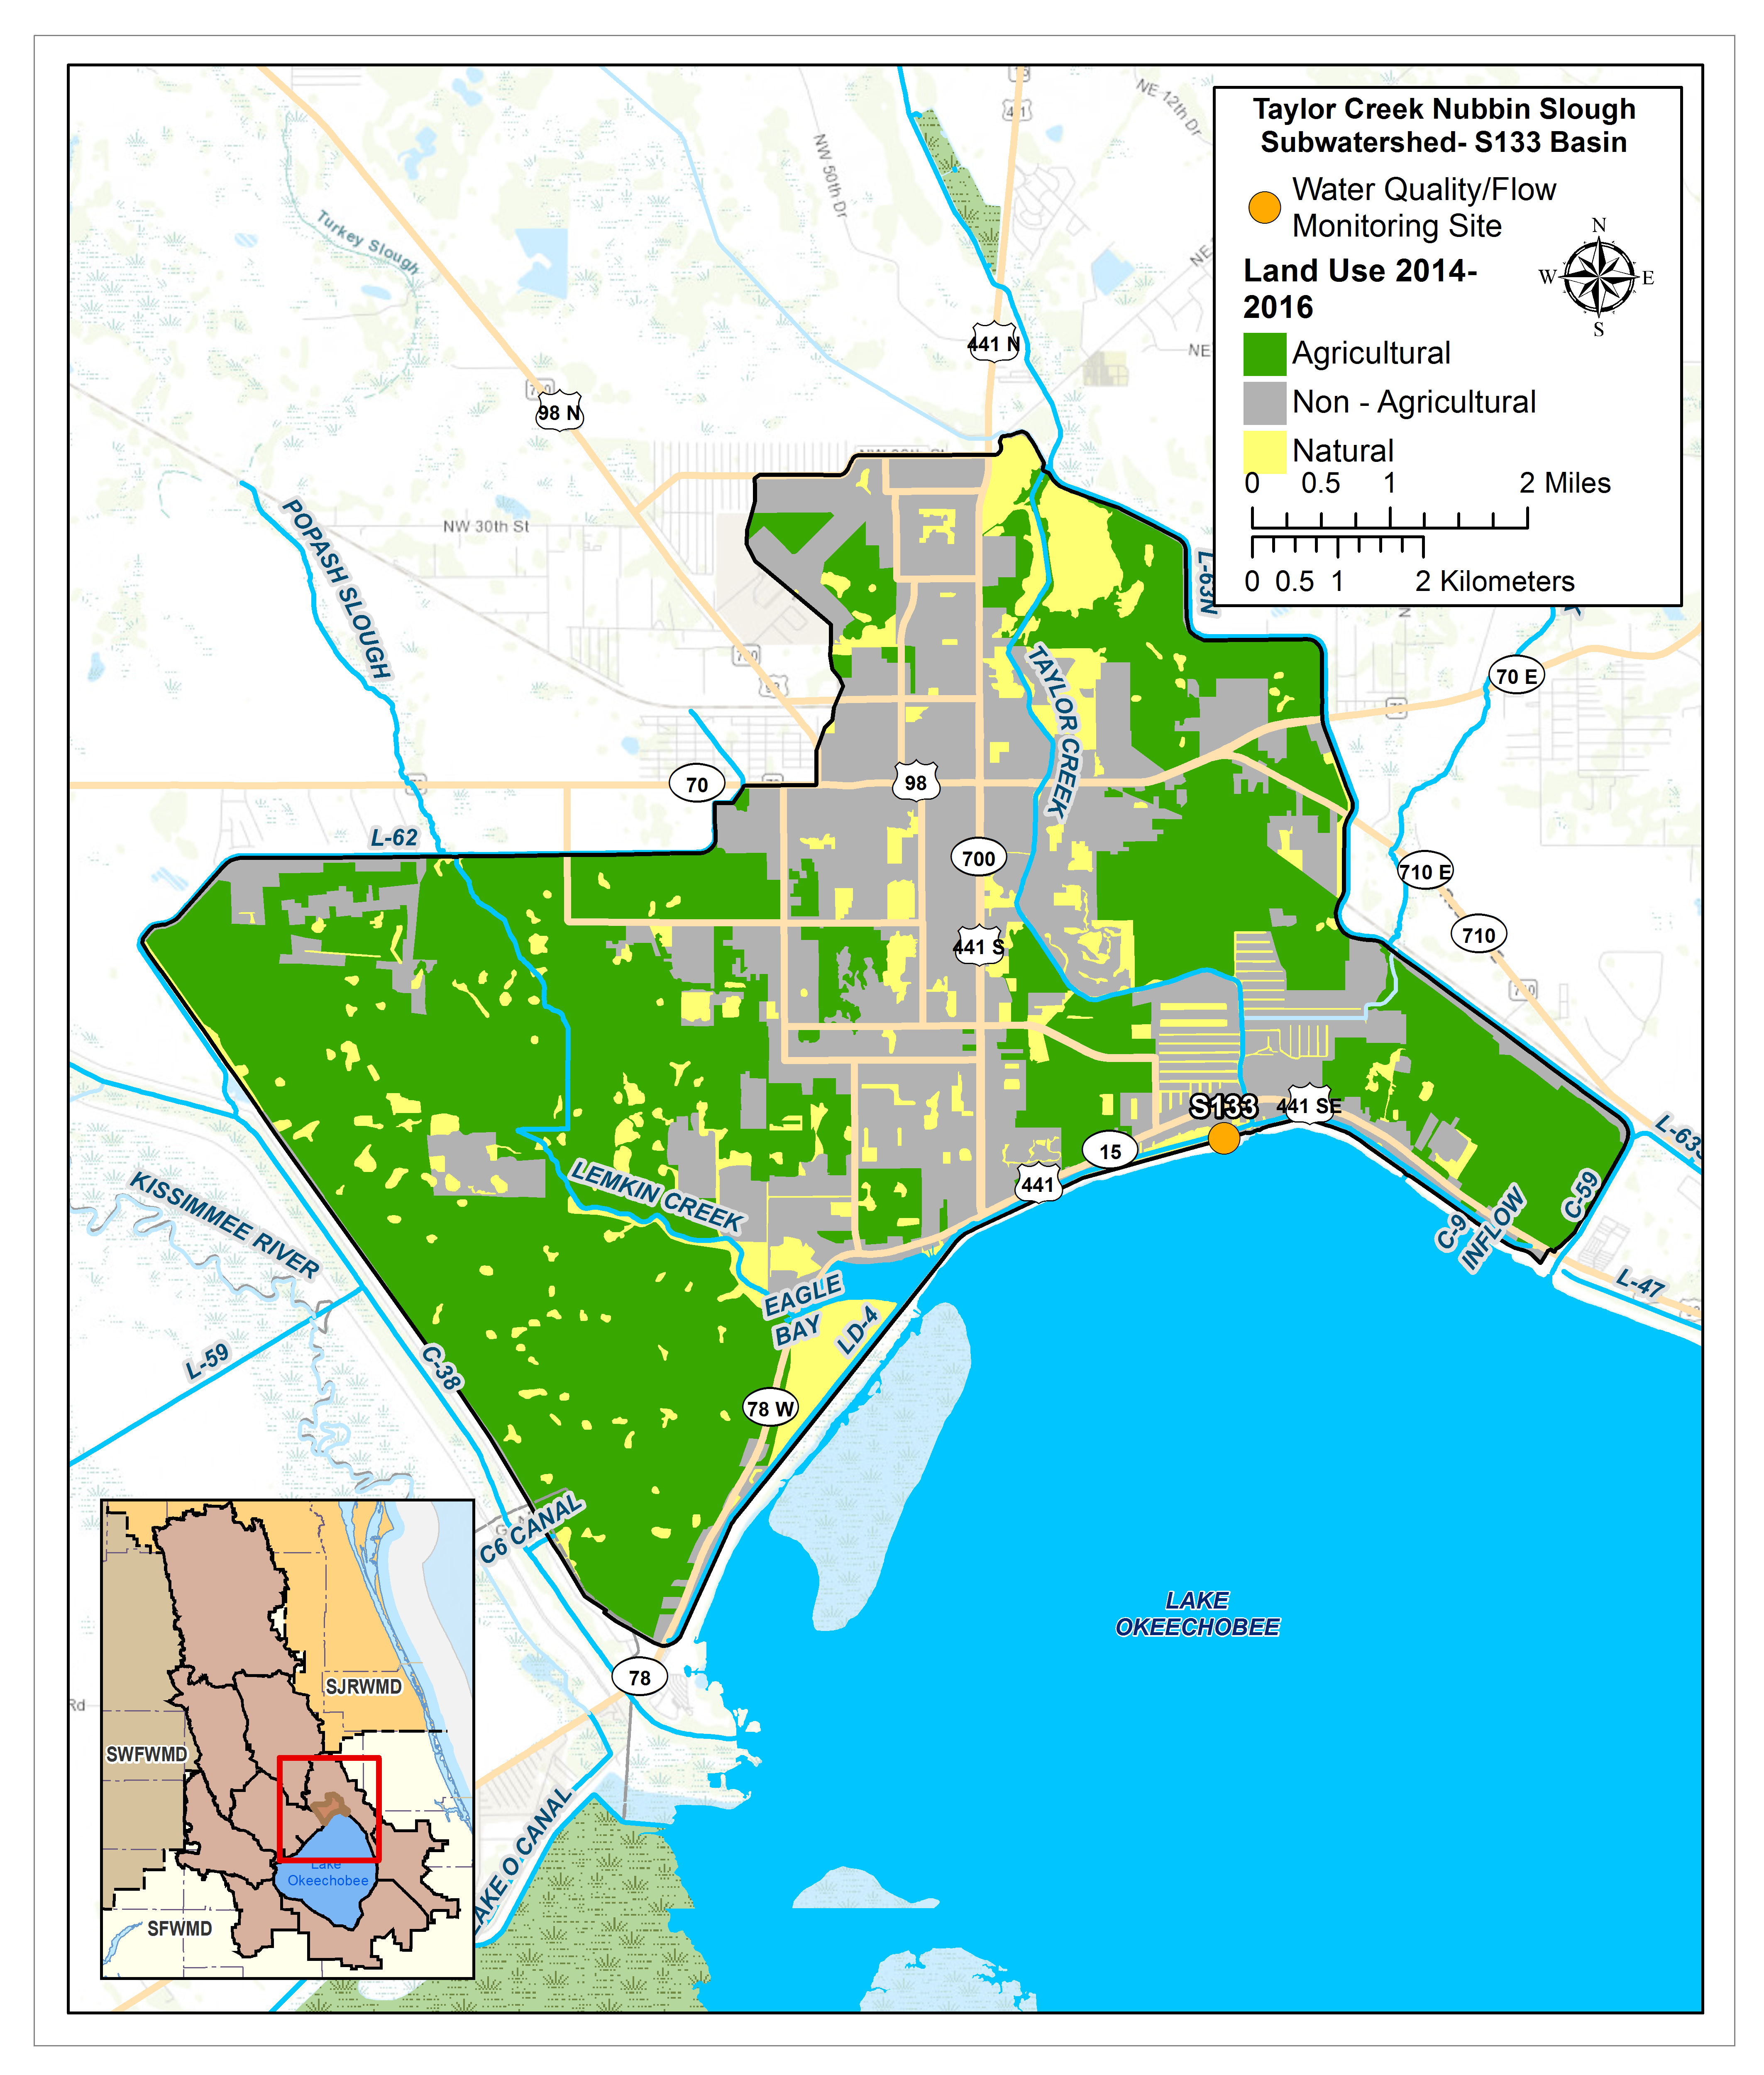
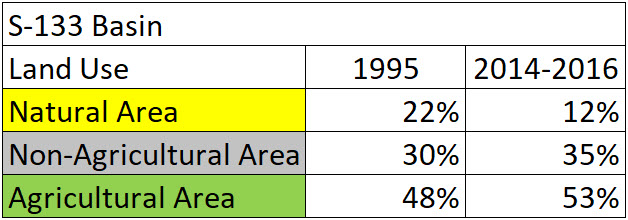
S133 BASIN
Total Area: 25,626ac
% Area of Subwatershed: 13%
% TP Load of Lake Okeechobee Watershed: 7%
Monitoring Locations: S133
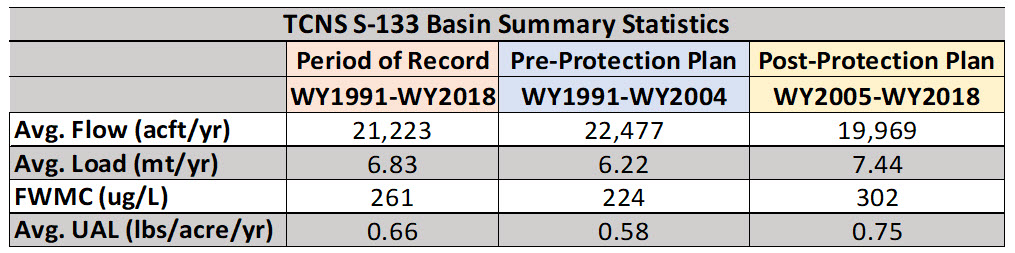
Flow Issues: Maybe
- There were no statistically significant trends in flows and they did not appear to change from the pre to post-protectoin plan period.
- Need to determine if the pump operation is representative of the runoff. In other words, is the water sometimes moved for water management activities. Also, it is uncertain how much water exchange occurs at the locks.
Water Quality Issues: Yes
- The total phosphorus (TP) flow-weighted mean concentrations (FWMC) for the post-protection plan period were 302 μg/L. TP data need further investigation.
>>Additional Technical Information
PROJECTS LOCATED IN THIS BASIN
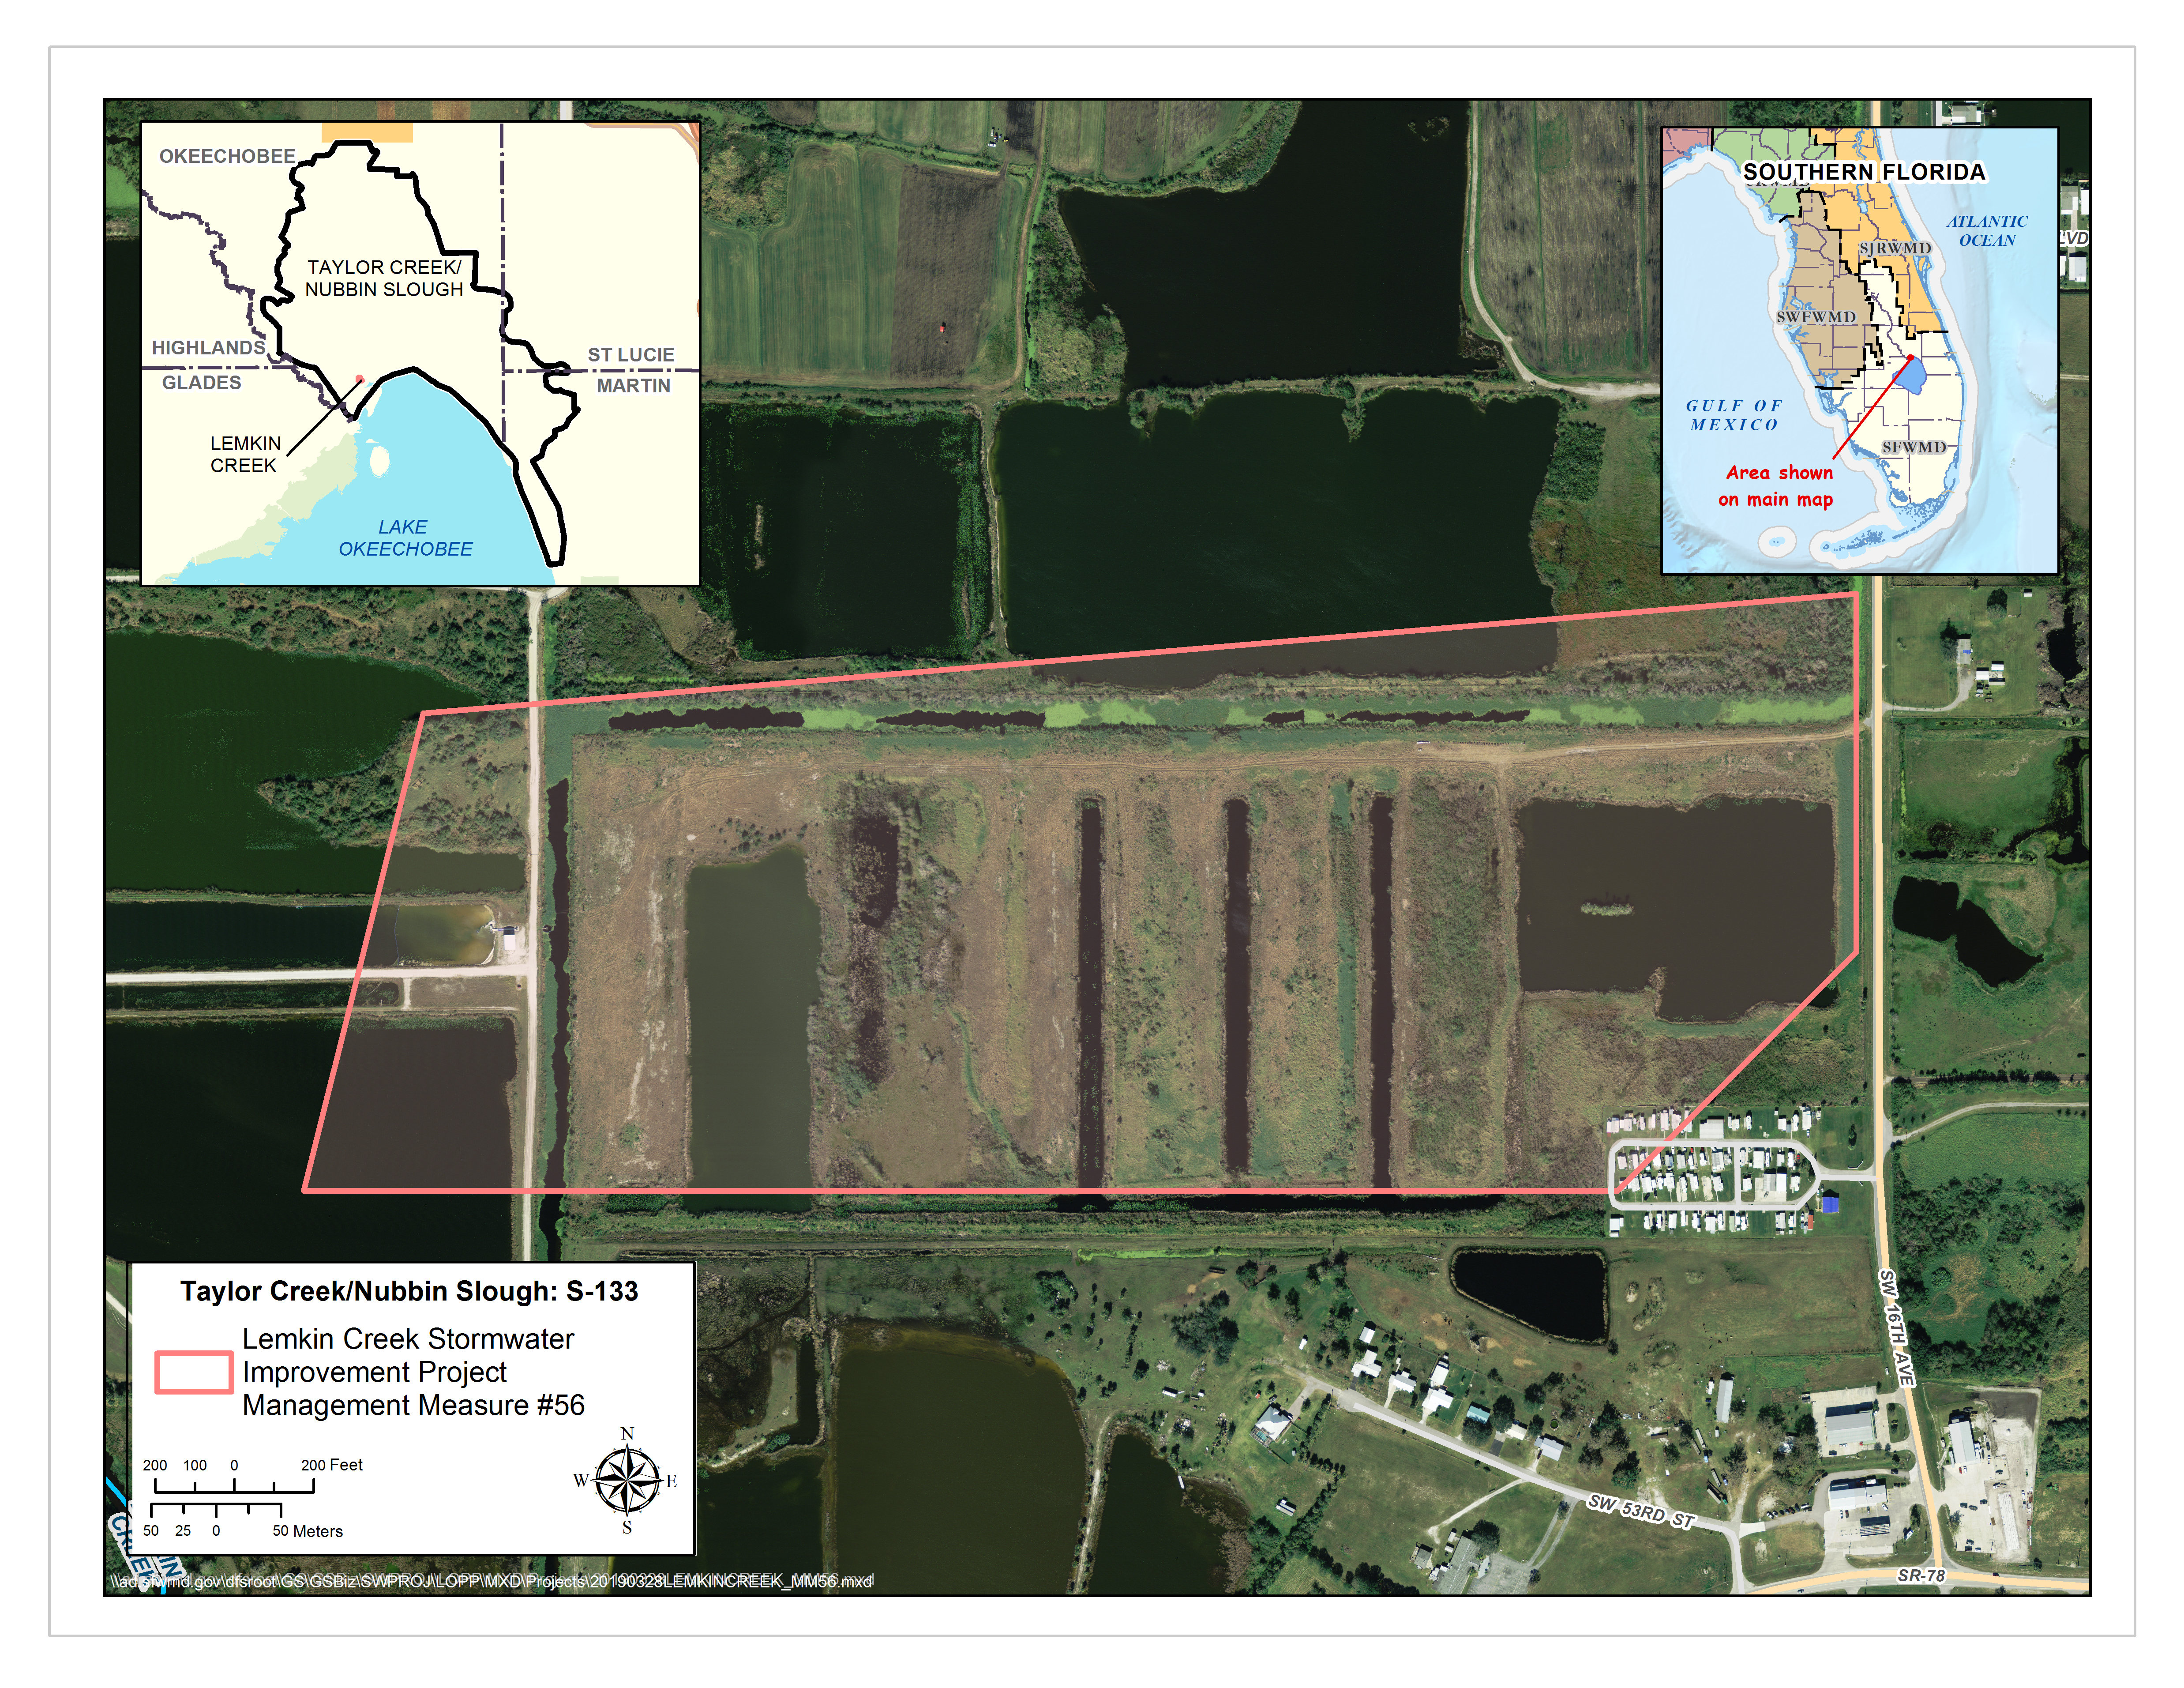 Purpose: Increase storage and remove phosphorus from stormwater before it enters Lake Okeechobee.
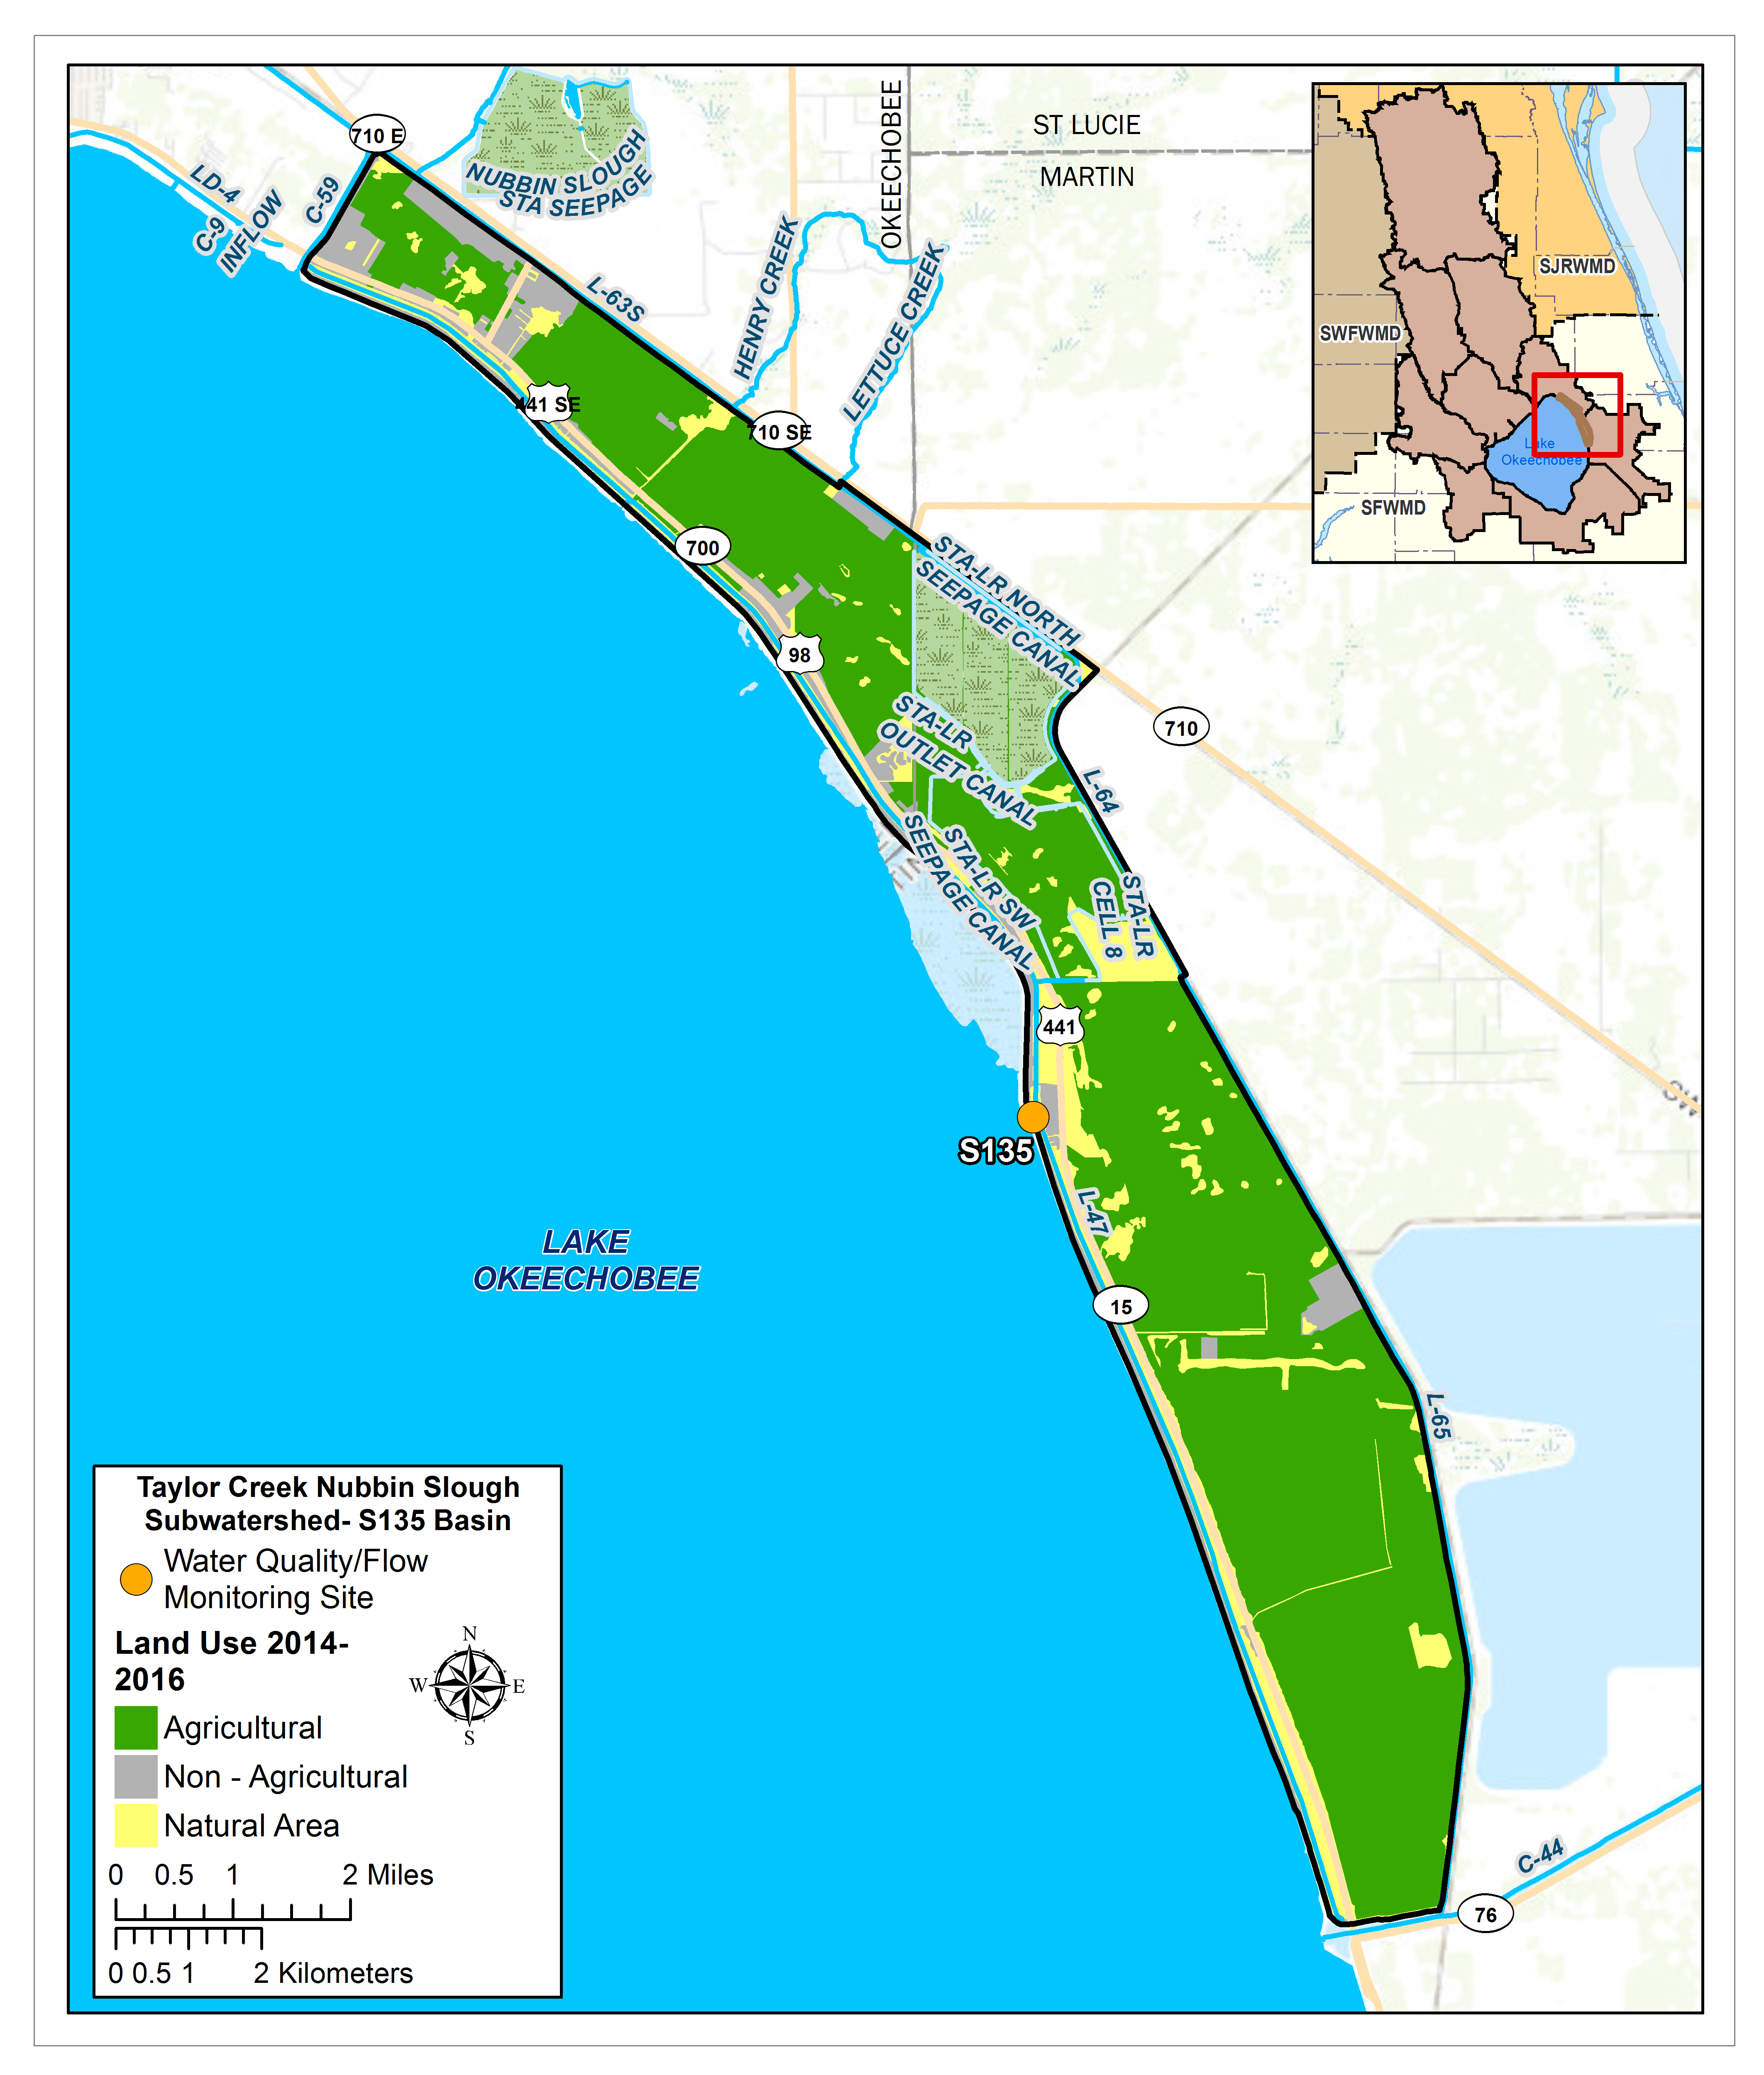
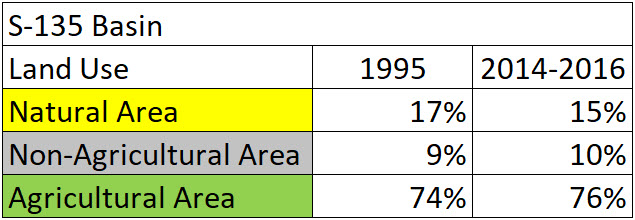
S135 BASIN
Total Area: 17,756ac
% Area of Subwatershed: 9%
% TP Load of Lake Okeechobee Watershed: 4%
Monitoring Locations: S135
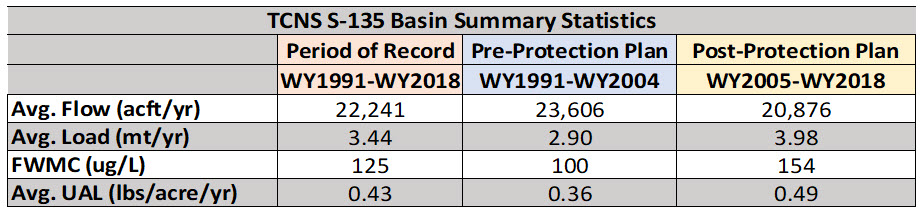
Flow Issues: No
- There were no statistically significant trends in flows.
- Need to determine if the pump operation is representative of the runoff. In other words, is the water sometimes moved for water management activities. Also, it is uncertain how much water exchange occurs at the locks.
Water Quality Issues: No
- The total phosphorus (TP) flow-weighted mean concentrations (FWMC) appear to be in a relatively good range (154 μg/L during the post-protection plan period) and are relatively low overall compared to other areas of the Taylor Creek/Nubbin Slough Subwatershed.
- The data indicates that there have been spikes in TP FWMC that appear to correspond to weather events.
>>Additional Technical Information
PROJECTS LOCATED IN THIS SUBWATERSHED
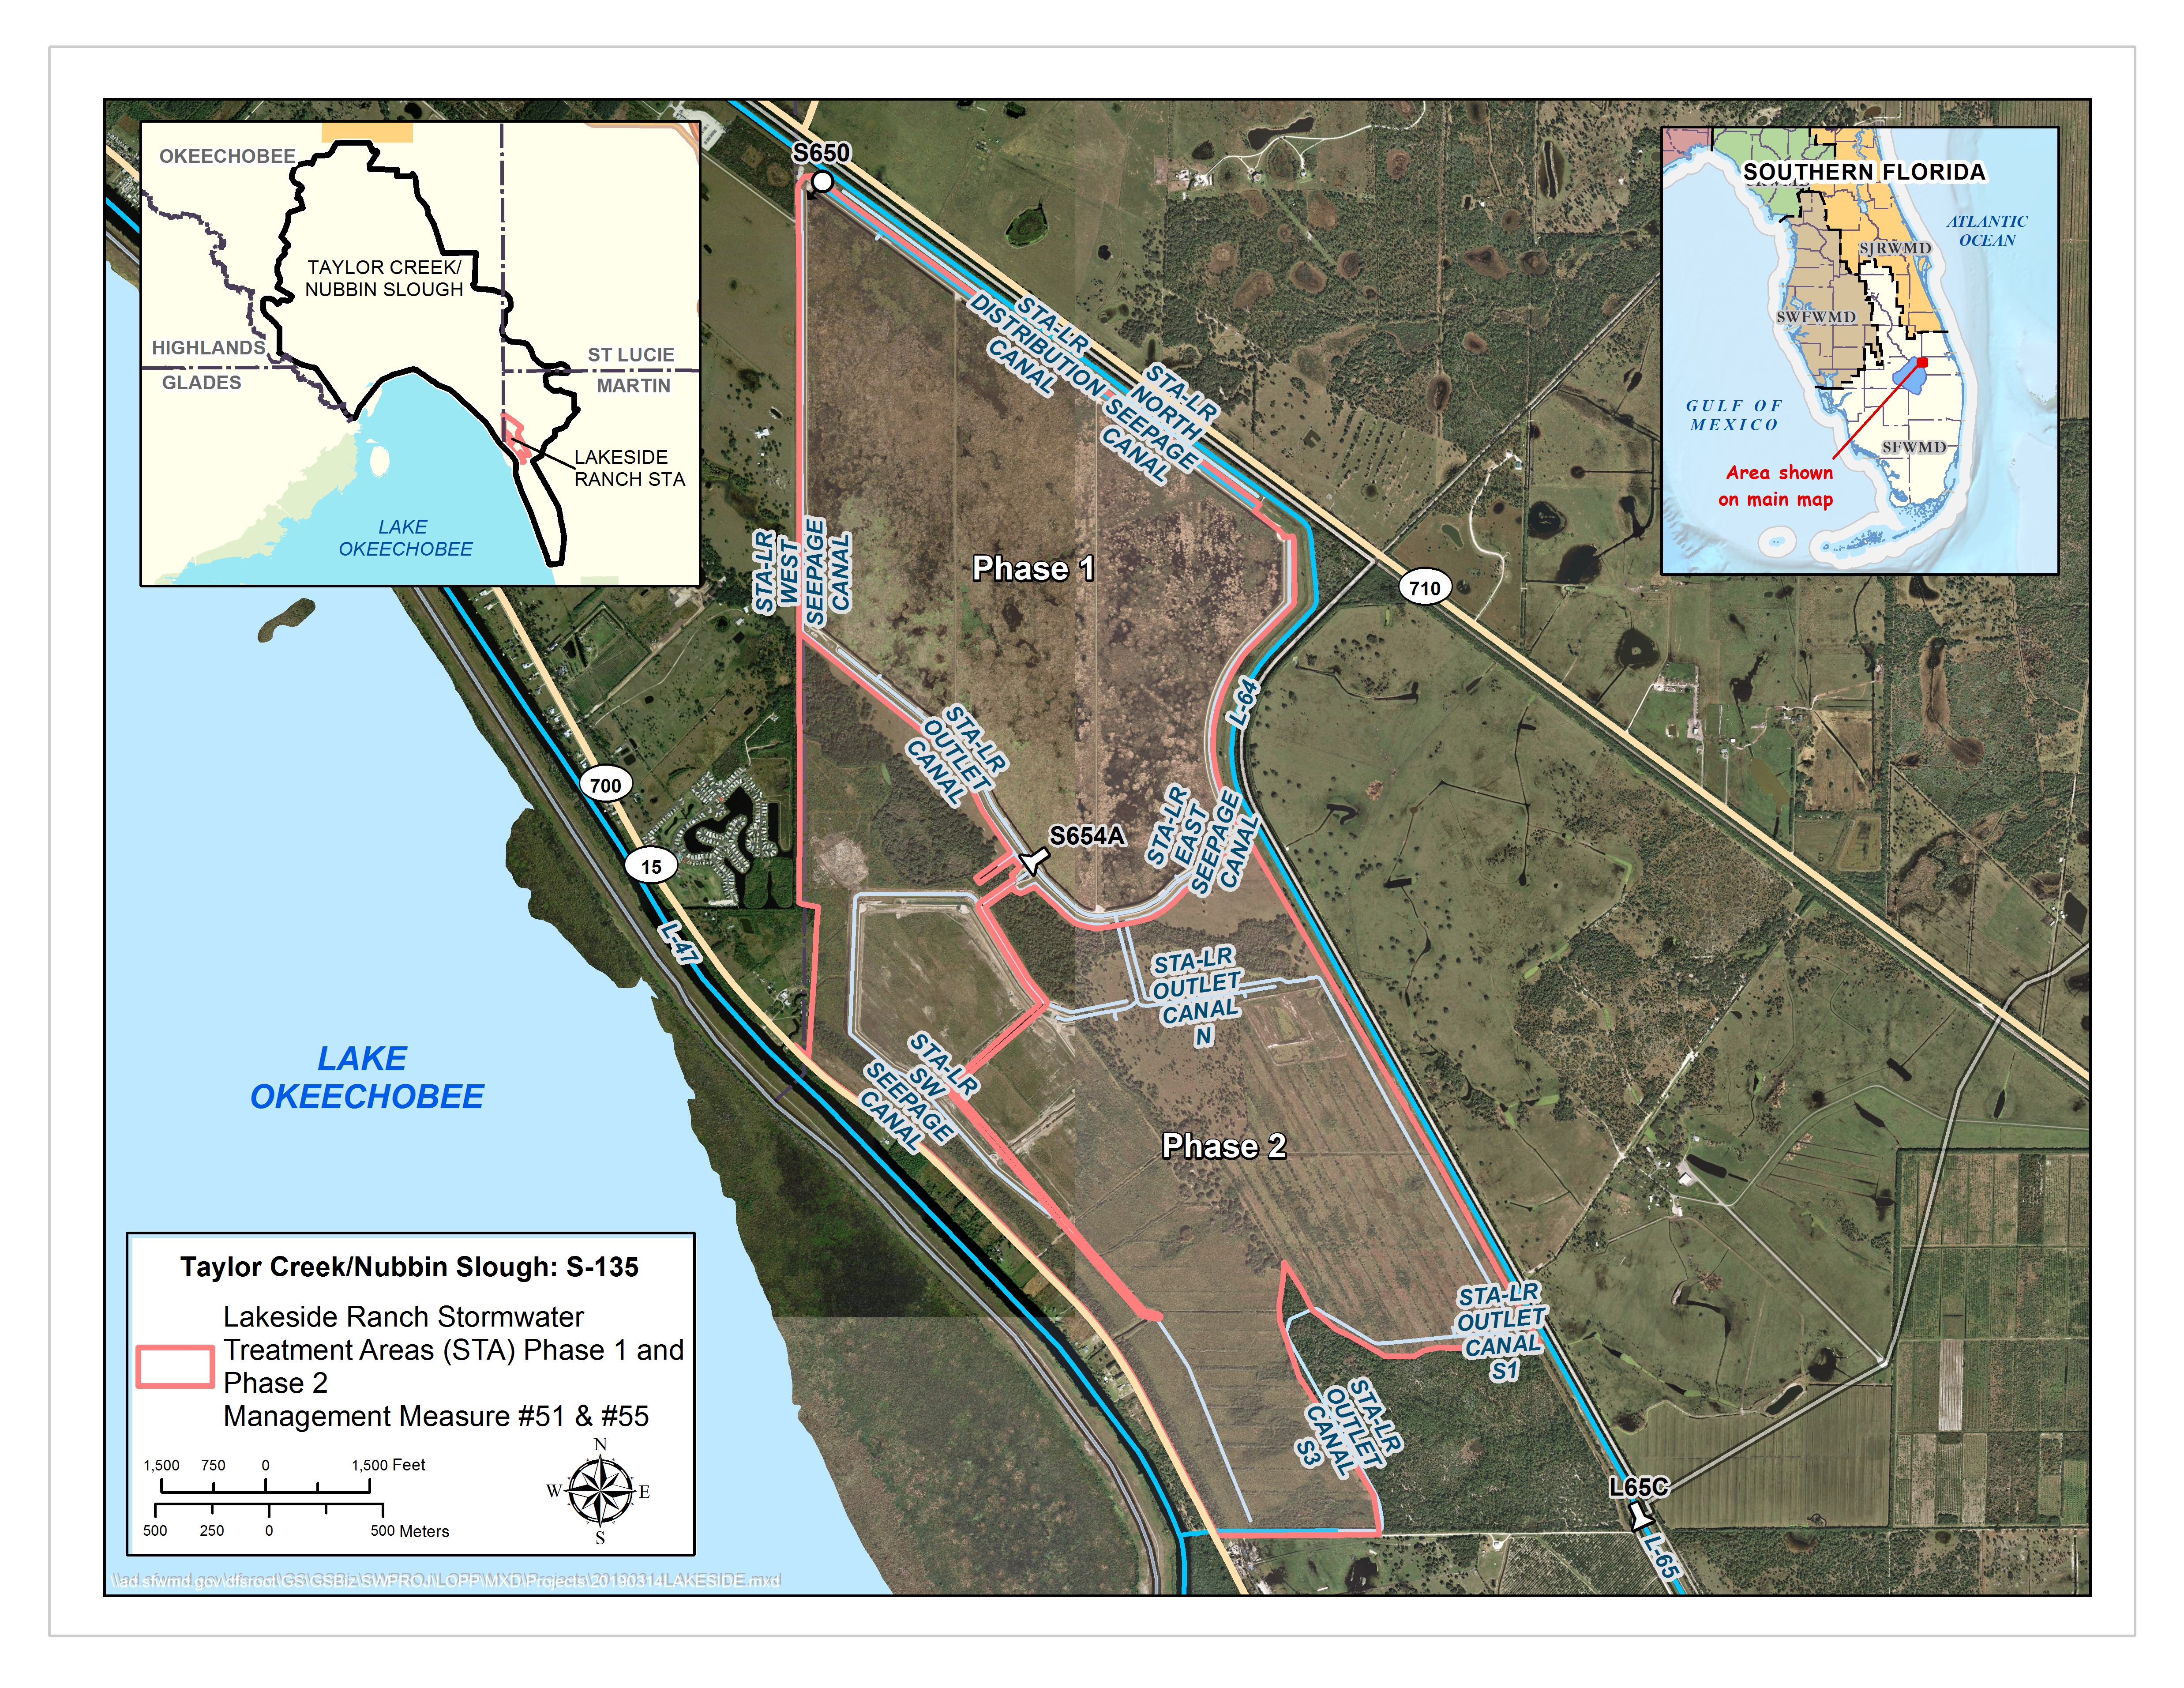 Purpose: Capture and reduce the amount of total phosphorus from the S-191 and S-135 basins prior to discharge back into the L-47 rim canal and eventually into Lake Okeechobee.
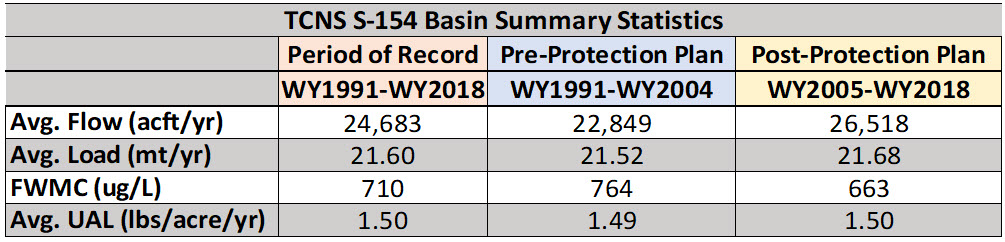
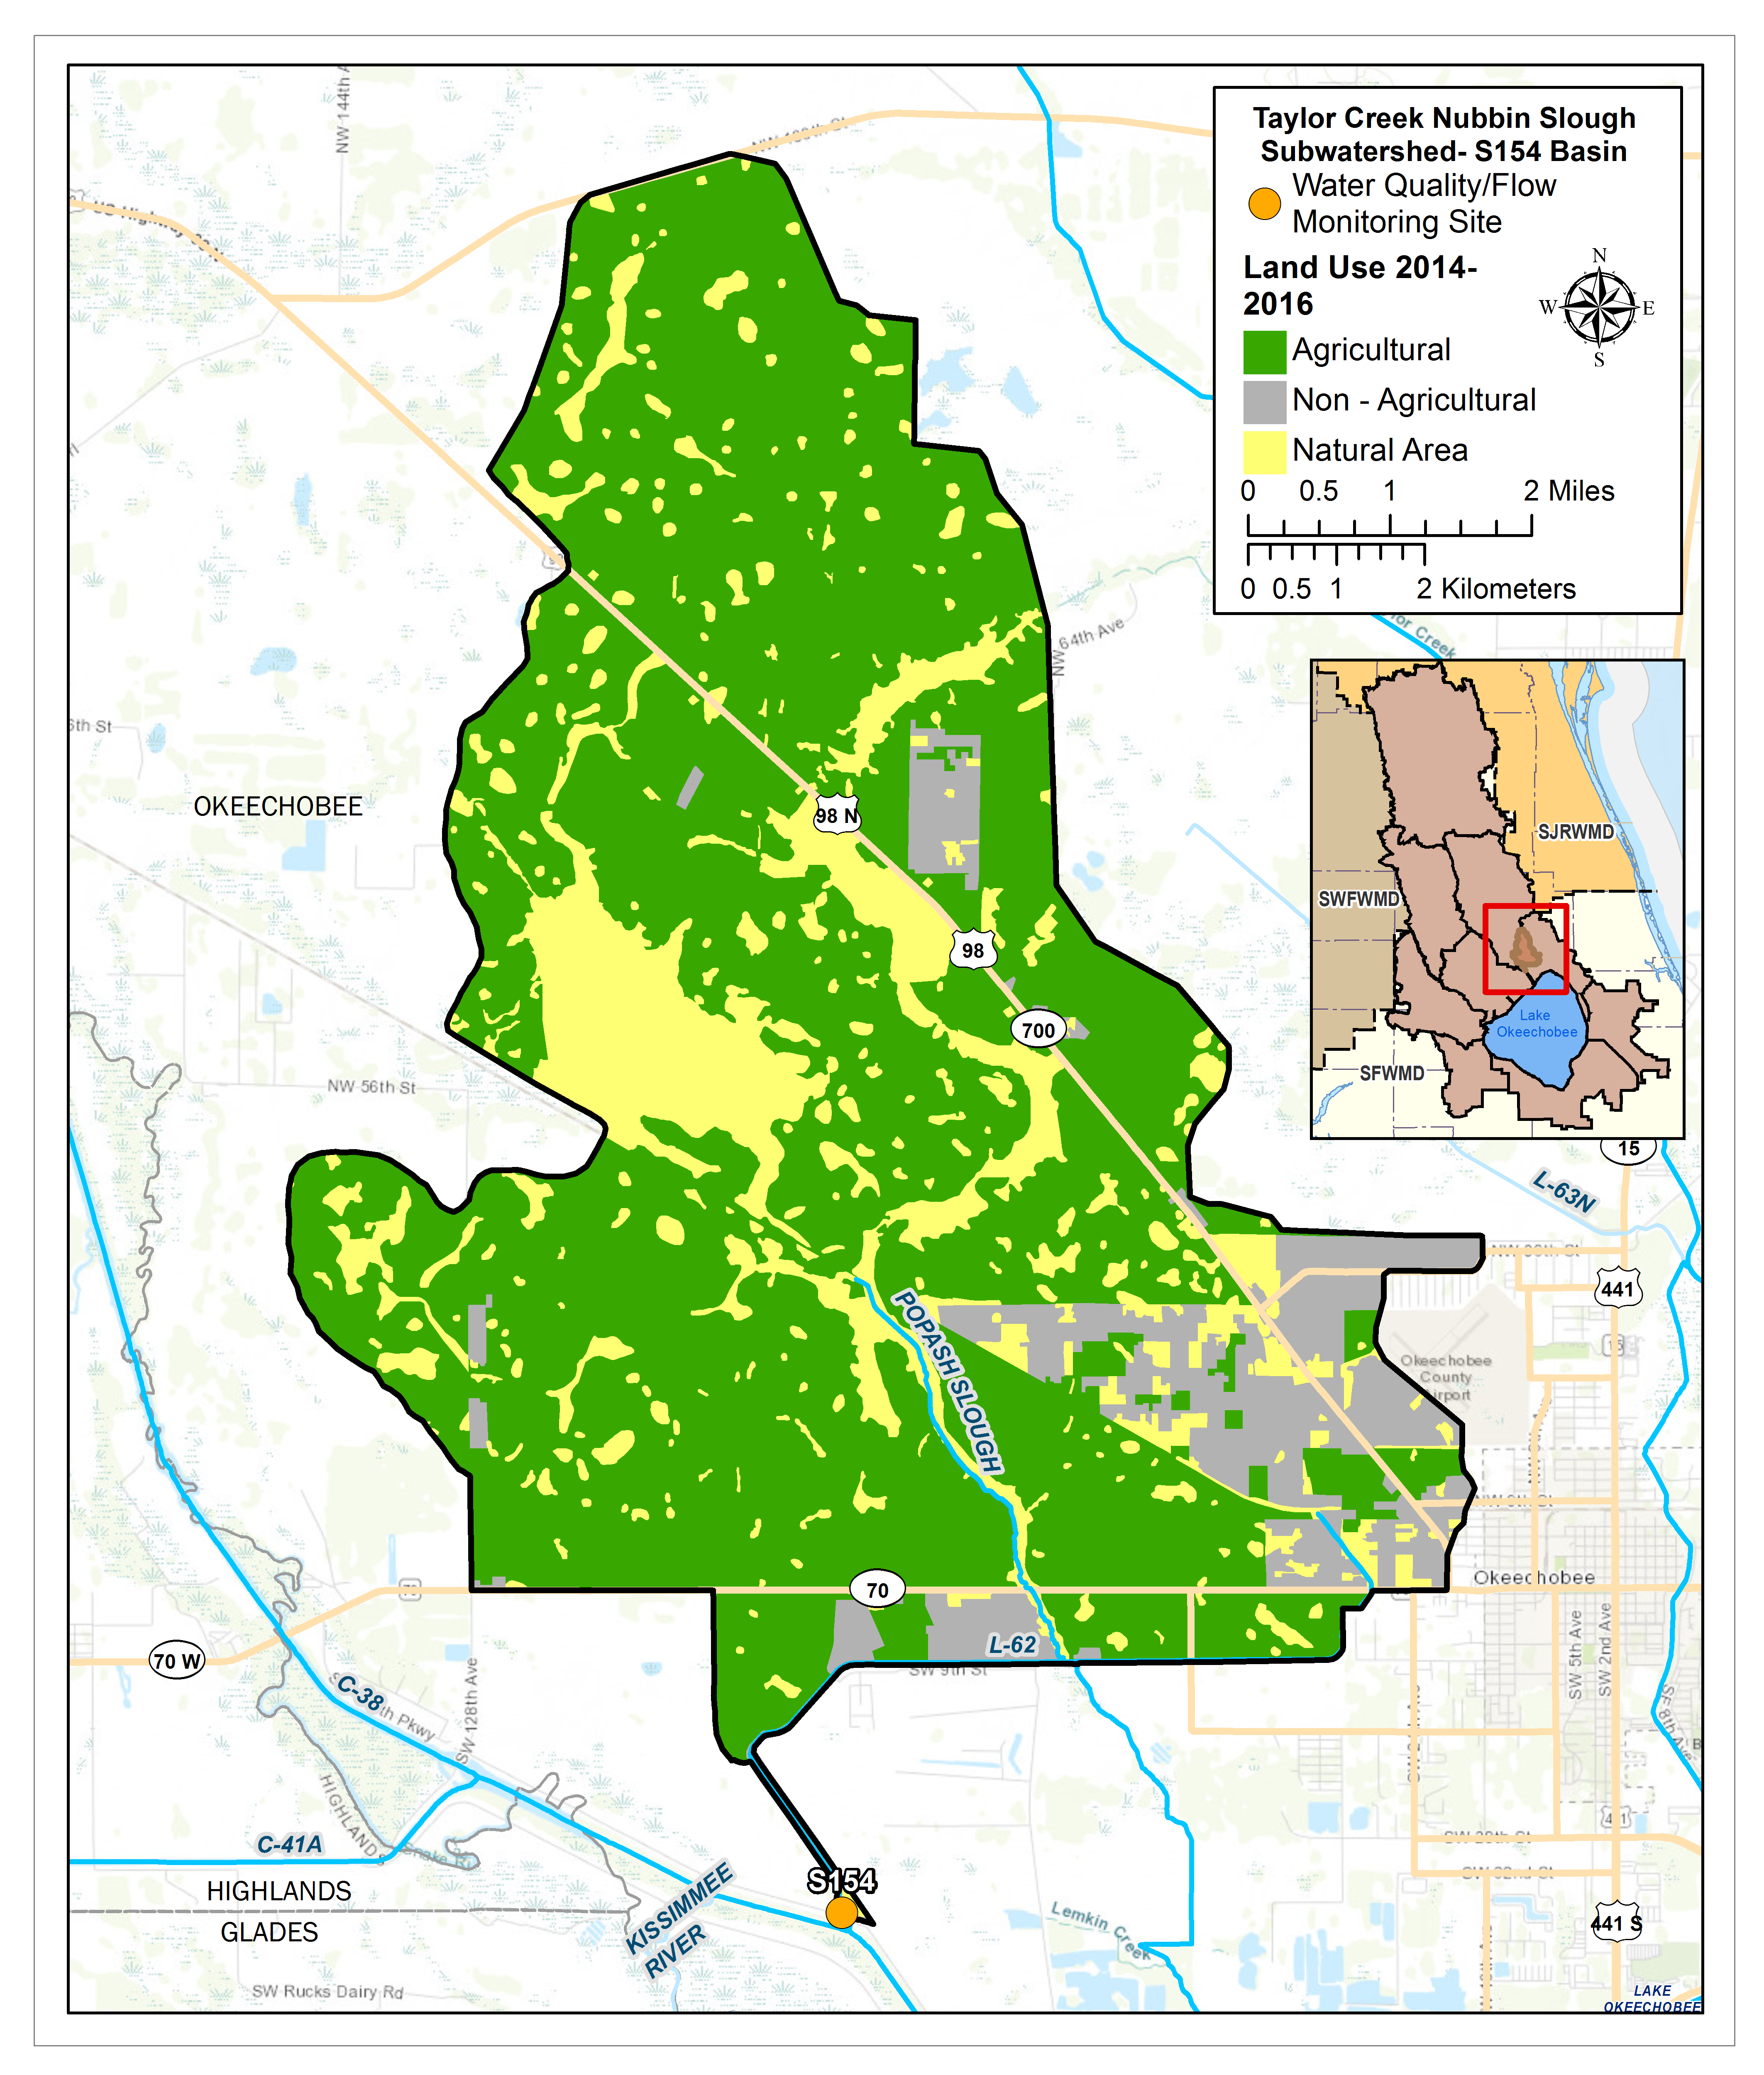
S154 BASIN
Total Area: 31,815ac
% Area of Subwatershed: 16%
% TP Load of Lake Okeechobee Watershed: 21%
Monitoring Locations: S154
Flow Issues: Maybe
- There were no statistically significant differences in flows from the pre to the post-protection plan periods and no statistically significant trends within any of the periods.
- The overall flow contribution to Lake Okeechobee watershed from this basin is low (approximately 1% ).
Water Quality Issues: Yes
- This is one of the Northern Everglades and Estuaries Protection Plan (NEEPP) four Priority basins.
- While the basin did have a statistically significant decreasing trend in total phosphorus (TP) flow-weighted mean concentrations (FWMC) for the period of record and the pre-protection plan period, the basin continues to have high TP FWMC (663 μg/L during the post-protection plan period) and has the second highest TP load in the Taylor Creek Nubbin Slough subwatershed (21 mt/yr during the post-protection plan period).

>>Additional Technical Information
PROJECTS LOCATED IN THIS BASIN
 Purpose: Provide shallow storage, retention and detention to enhance Lake Okeechobee and estuary health by reducing discharge volumes, reducing nutrient loading to downstream receiving waters, and expanding groundwater recharge opportunities.
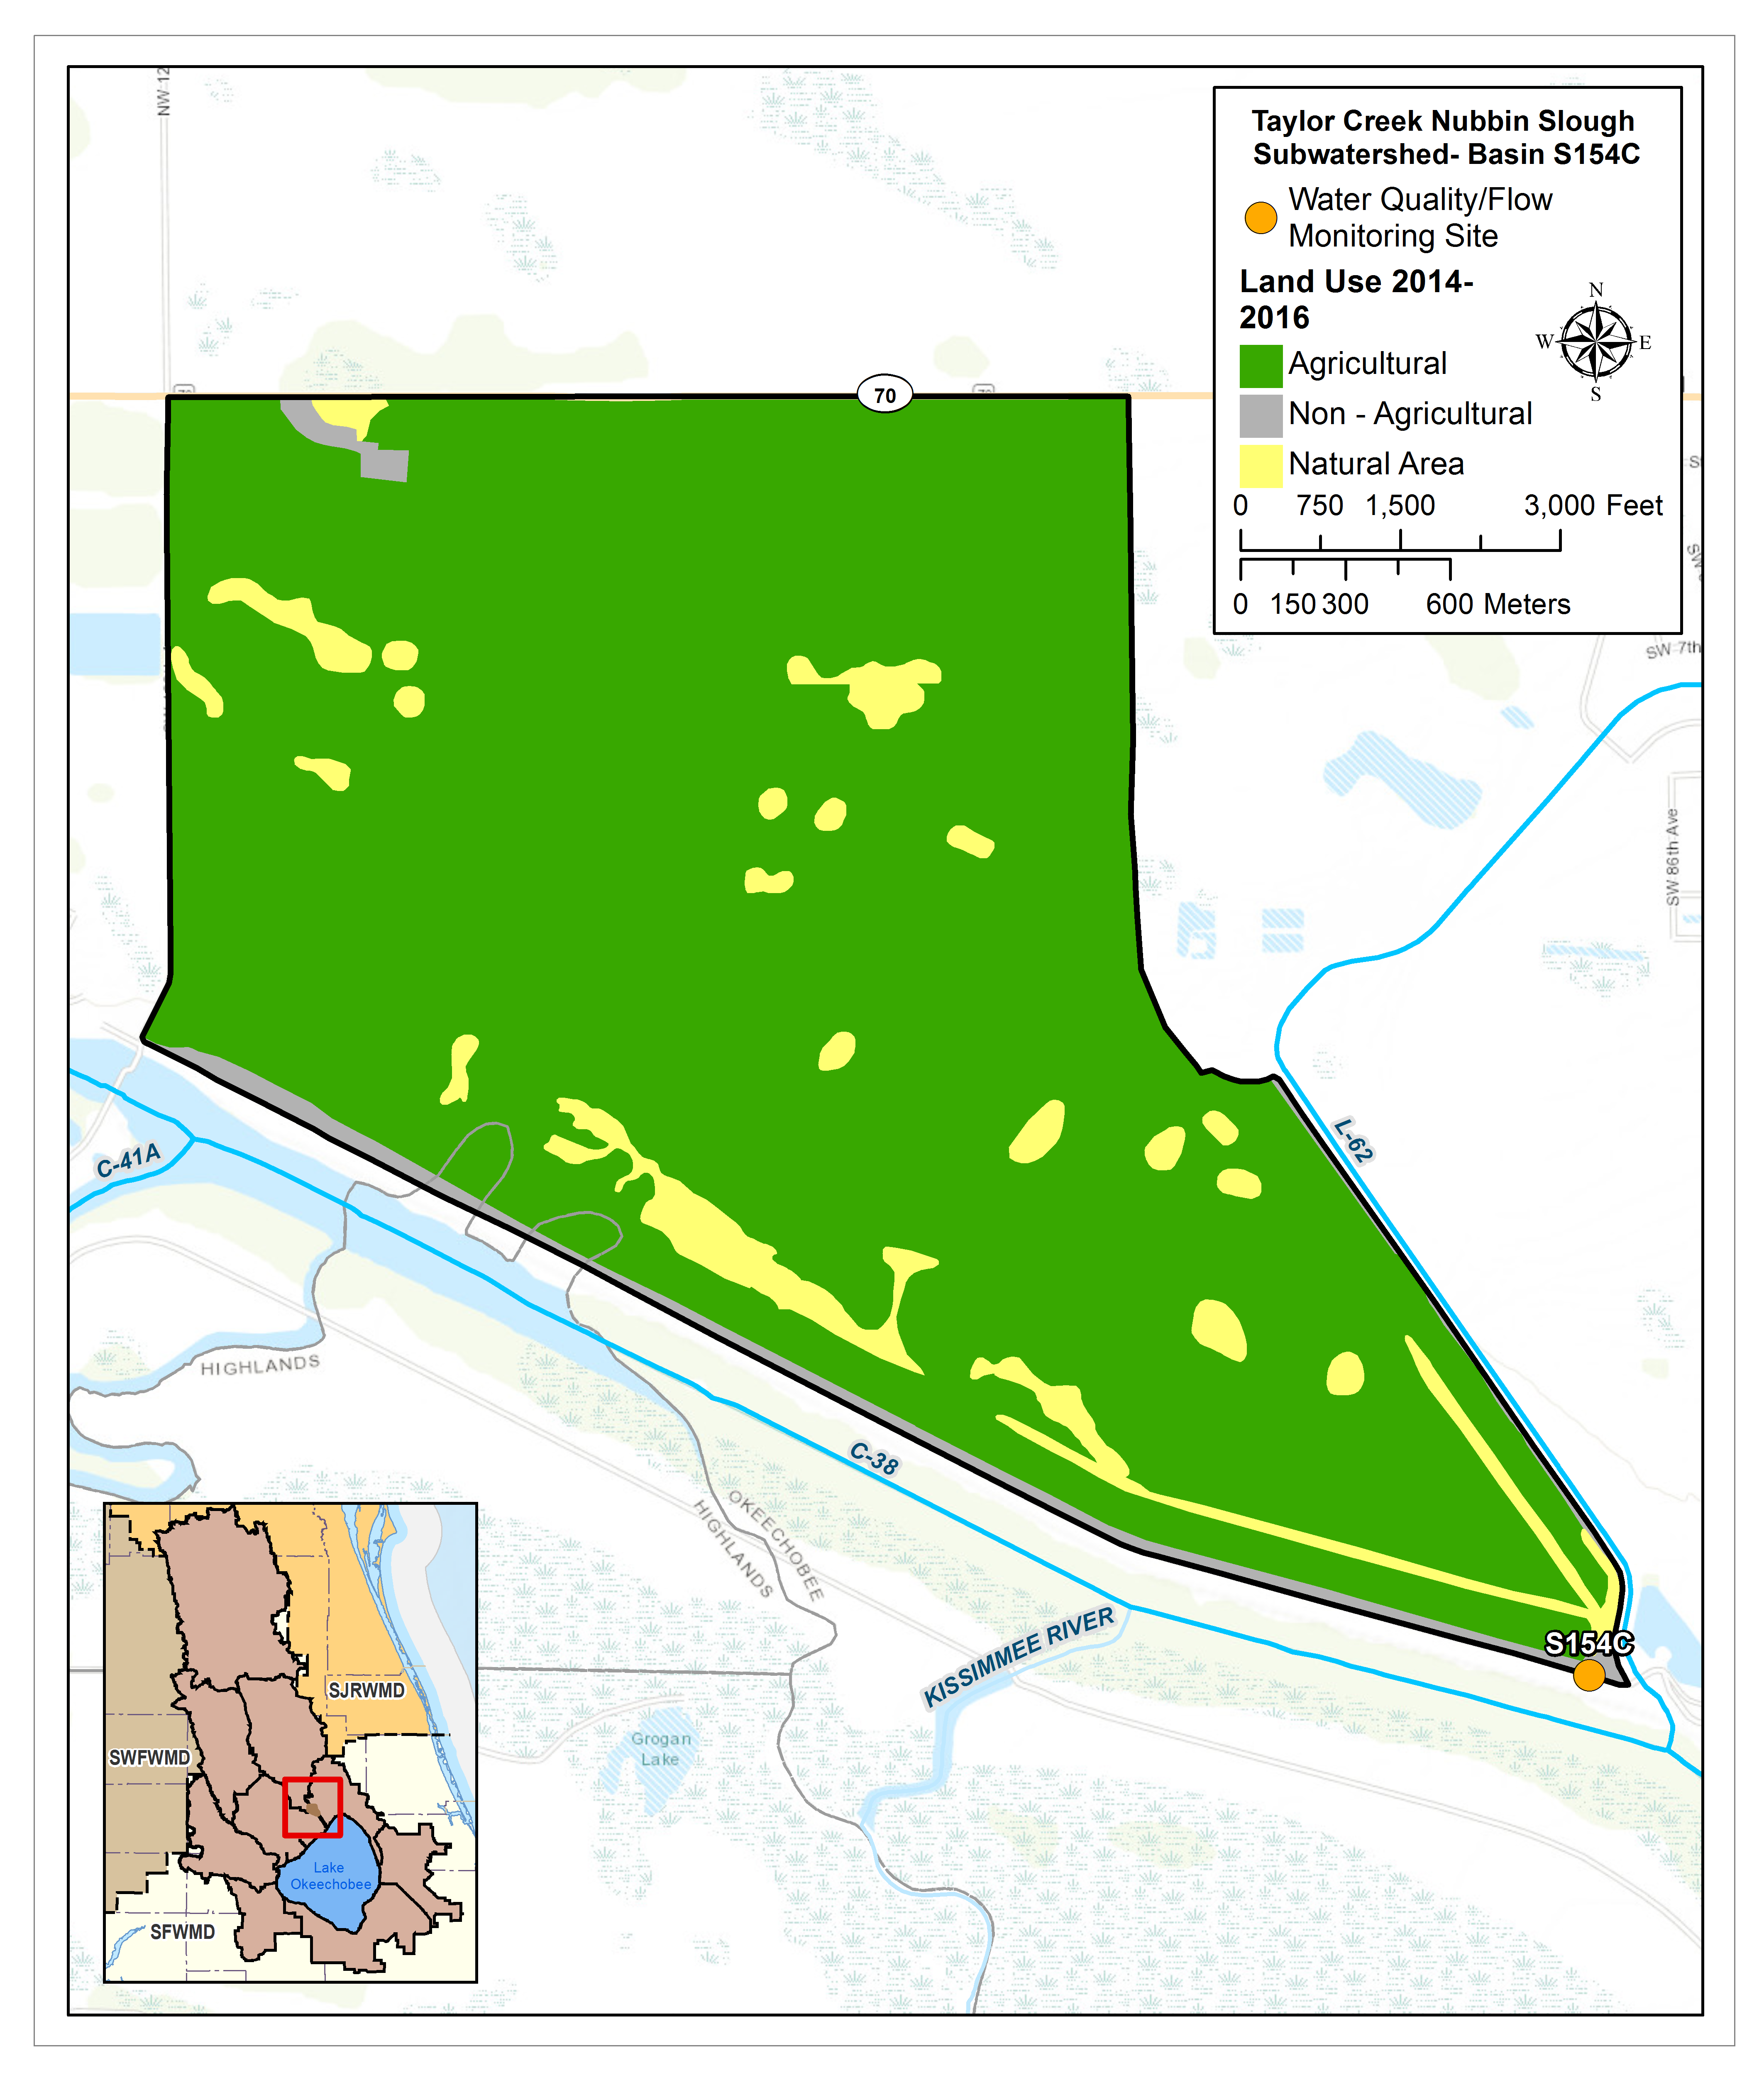
S154C BASIN
Total Area: 2,134ac
% Area of Subwatershed: 1%
% TP Load of Lake Okeechobee Watershed: 3%
Monitoring Locations: S154C
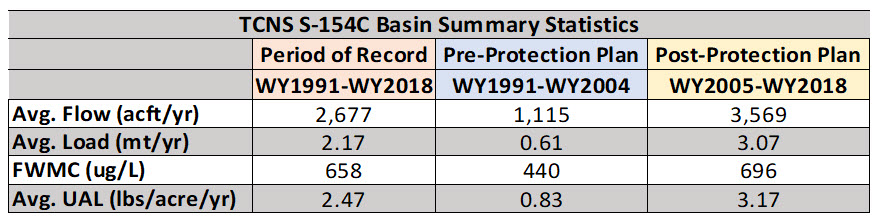
Flow Issues: Maybe
- Flow measurement changes occurred in the S-154C Basin during the pre and post-protection plan period. Need to investigate whether samples are representative of runoff areas.
- Flow data from 2009-present could be evaluated further for changes in trends since the same methods were used during this period.
Water Quality Issues: Yes
- This basin had high total phosphorus (TP) flow-weighted mean concentrations (FWMC) (696 μg/L during the post-protection plan period).
- The high TP unit area load (3.17 lbs/acre in the post-protection plan period) may be influenced by flow measurements and needs further investigation.
- This basin is only 1% of total subwatershed acreage (2,134 ac) and less than 0.1% of Lake Okeechobee Watershed acreage.
- This basin may be a good location for a project that captures runoff from S-154C and S-154 (FWMC also >600 μg/L) combined.

>>Additional Technical Information
S191 BASIN
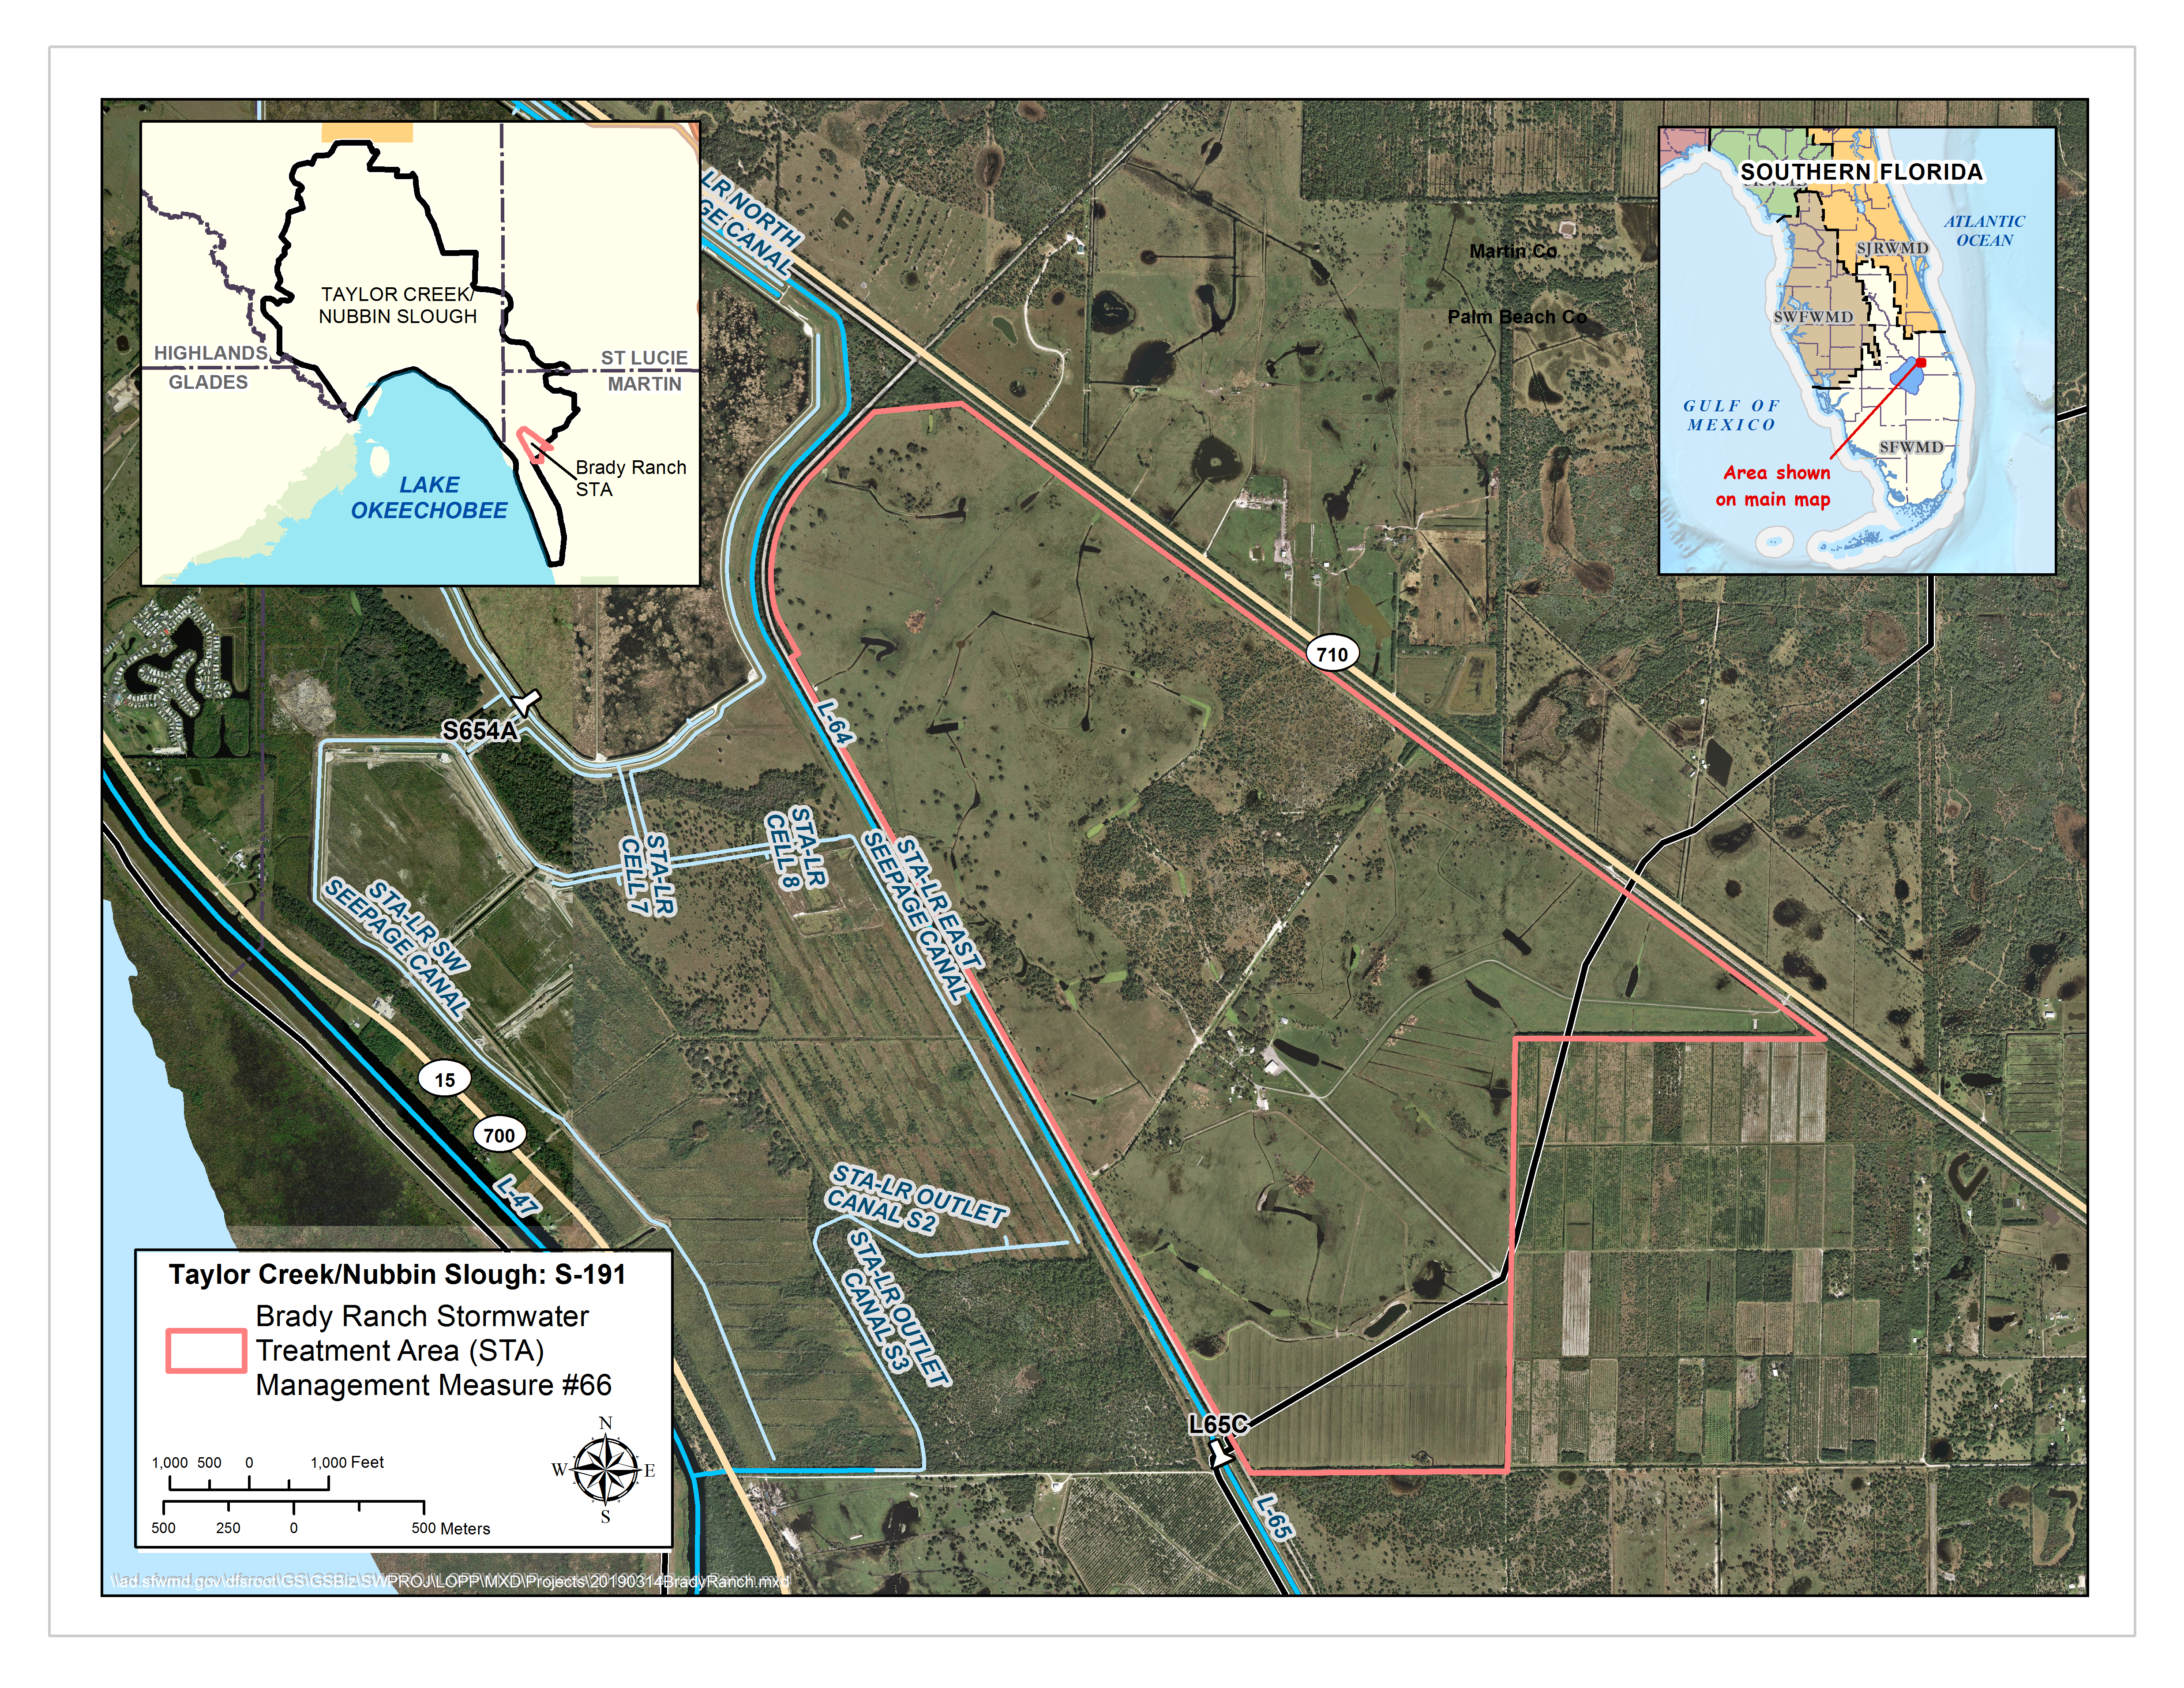
Total Area: 120,464ac (acreage includes the STAs)
% Area of Subwatershed: 61%
% TP Load of Lake Okeechobee Watershed: 65%
Monitoring Locations: S191
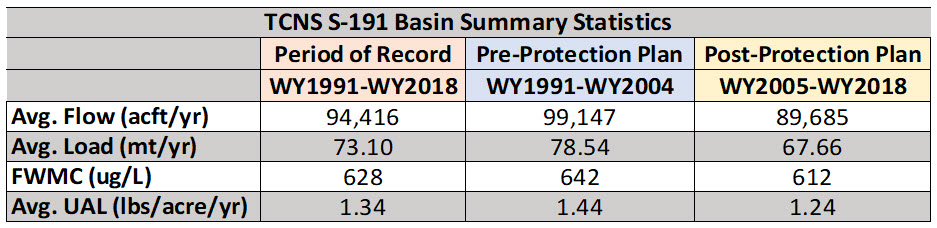
Flow Issues: Maybe
- This basin has the highest flows compared to the other basins in the Taylor Creek/Nubbin Slough subwatershed; runoff volumes are flashy.
- There was a statistically significant decreasing trend in flow for the period of record (WY1991 to WY2018).
Water Quality Issues: Yes
- This is one of the Northern Everglades and Estuaries Protection Plan (NEEPP) four Priority basins.
- While there is a statistically significant decreasing trend for the period of record for total phosphorus (TP) loads, this basin had high TP flow-weighted mean concentrations (FWMC) (612 μg/L during the post-protection plan period).
- The basin represents the majority of the TP loads for the Taylor Creek/Nubbin Slough subwatershed.

>>Additional Technical Information
PROJECTS LOCATED IN THIS BASIN
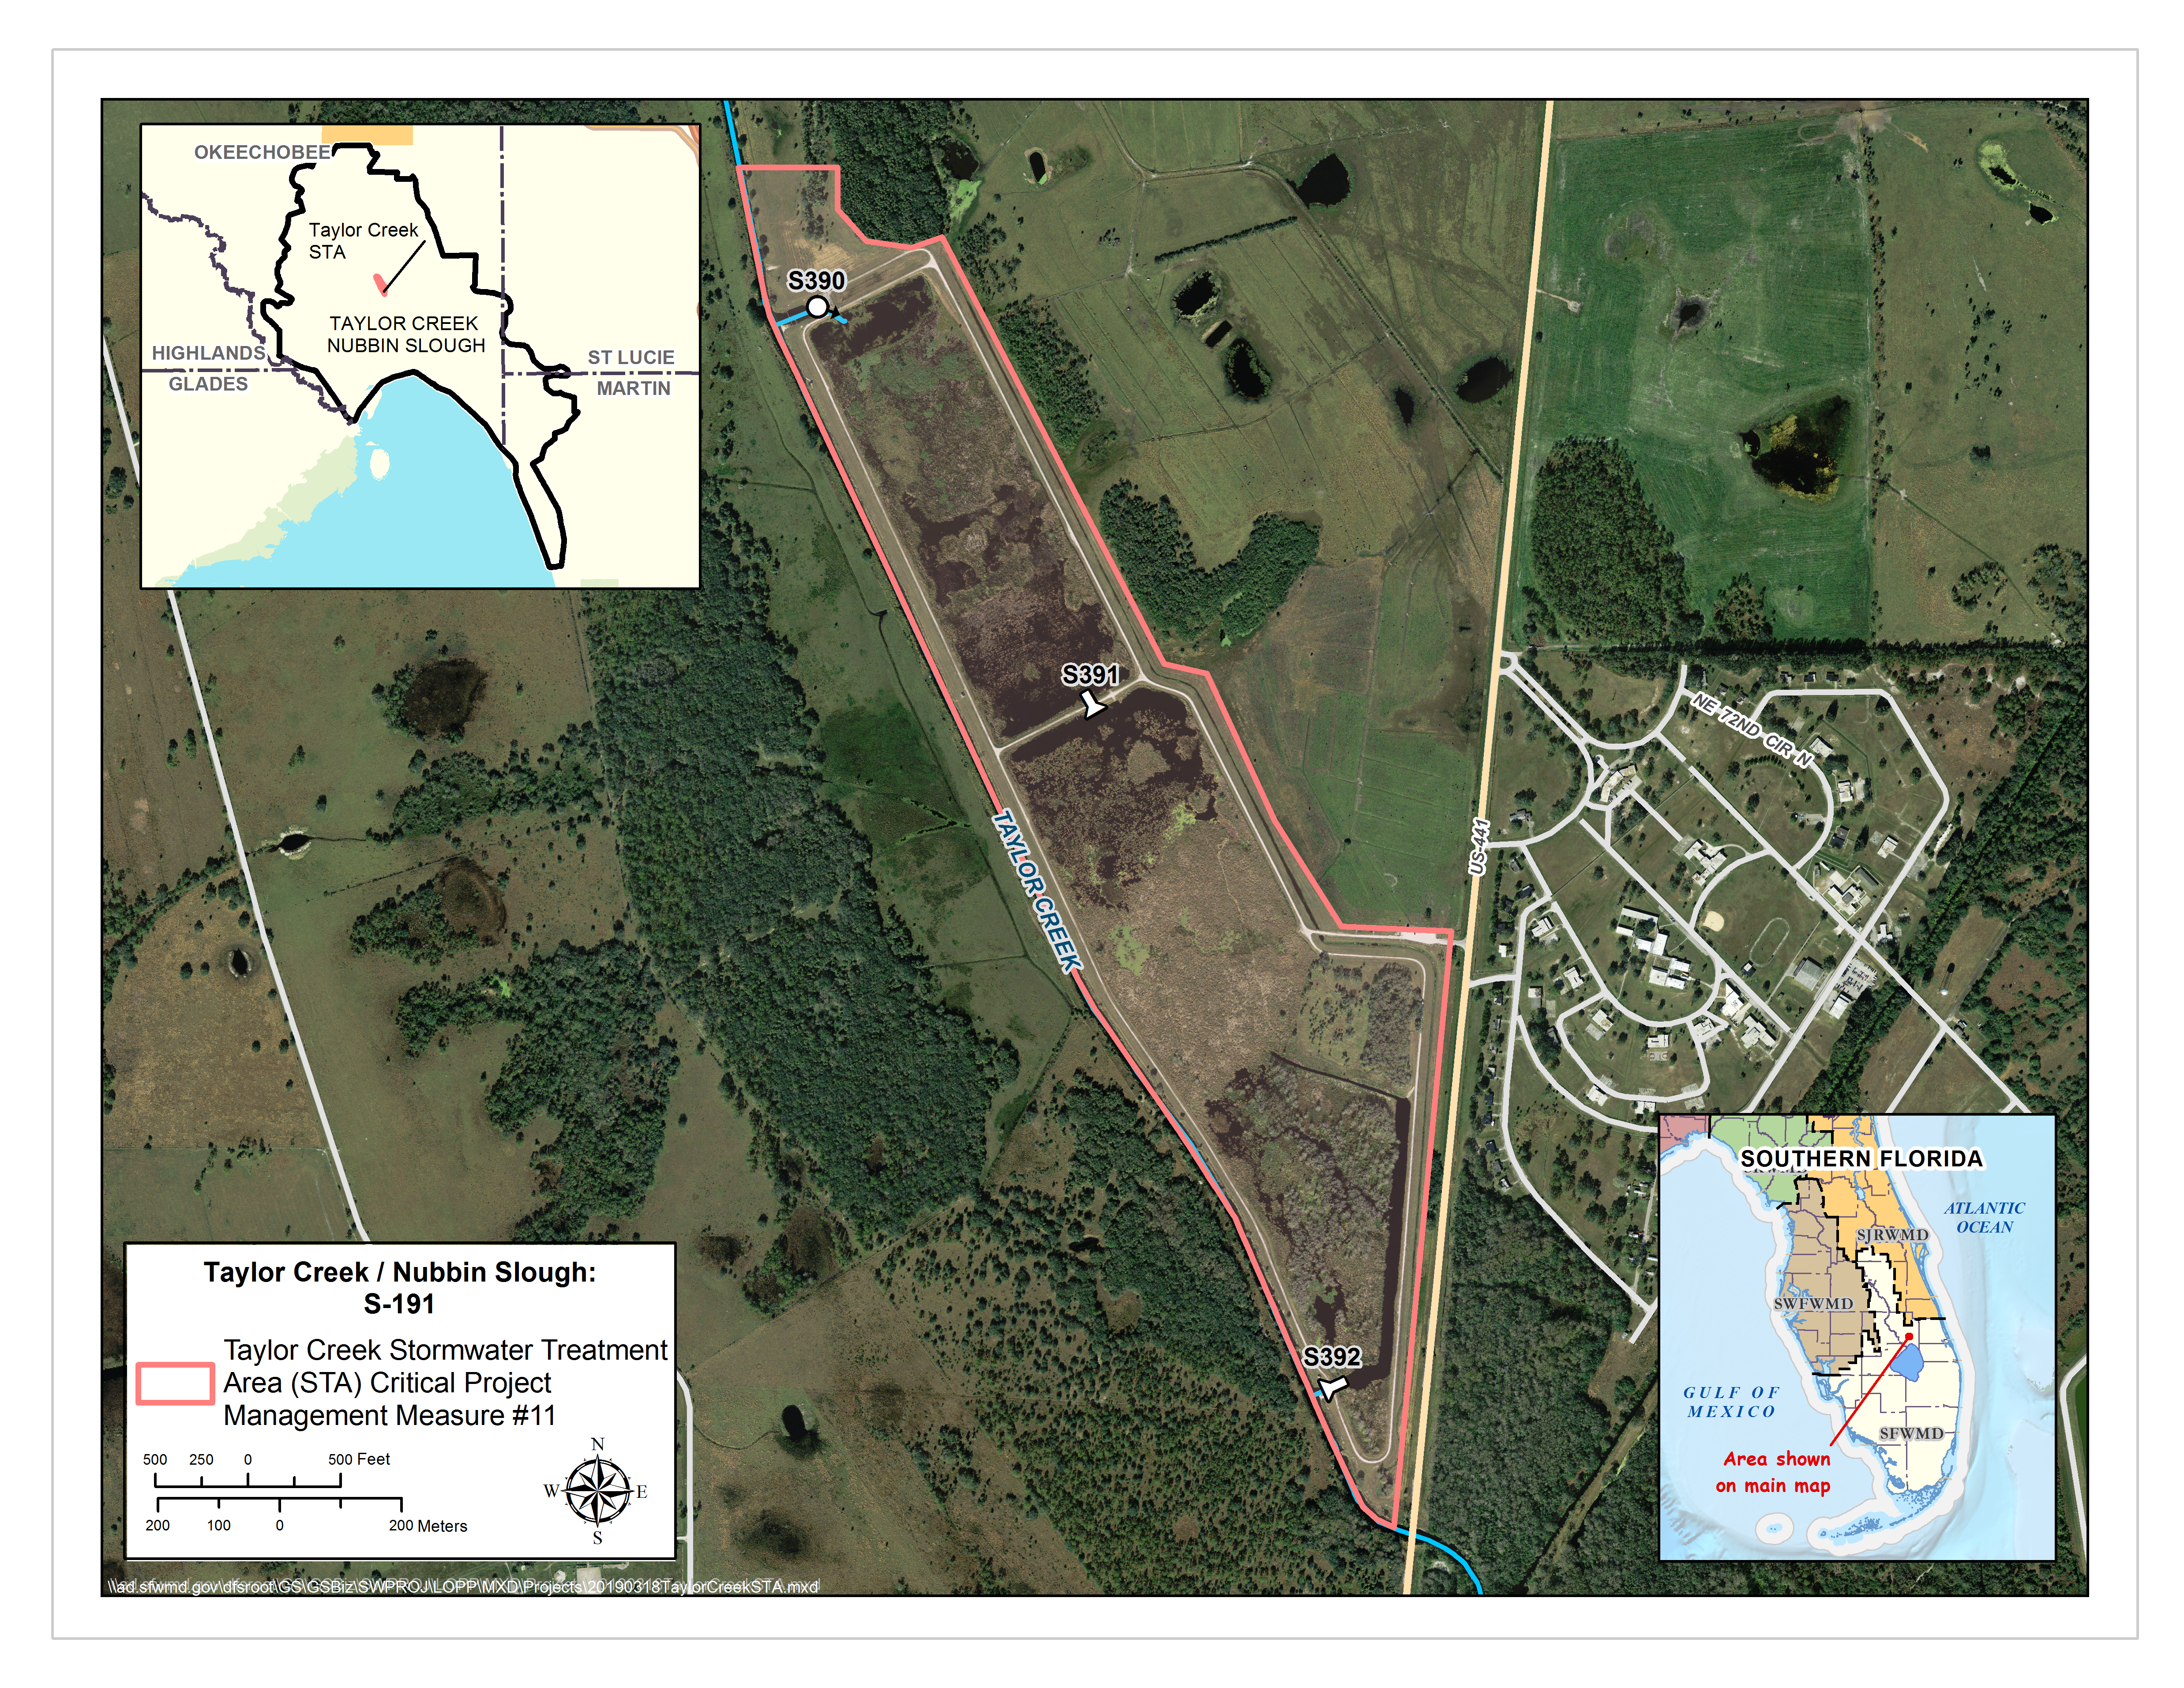 Purpose: Retain stormwater runoff and reduce phosphorus from the Taylor Creek Subwatershed. This STA is divided into two cells in series and is expected to treat about 10% of the water flow in Taylor Creek.
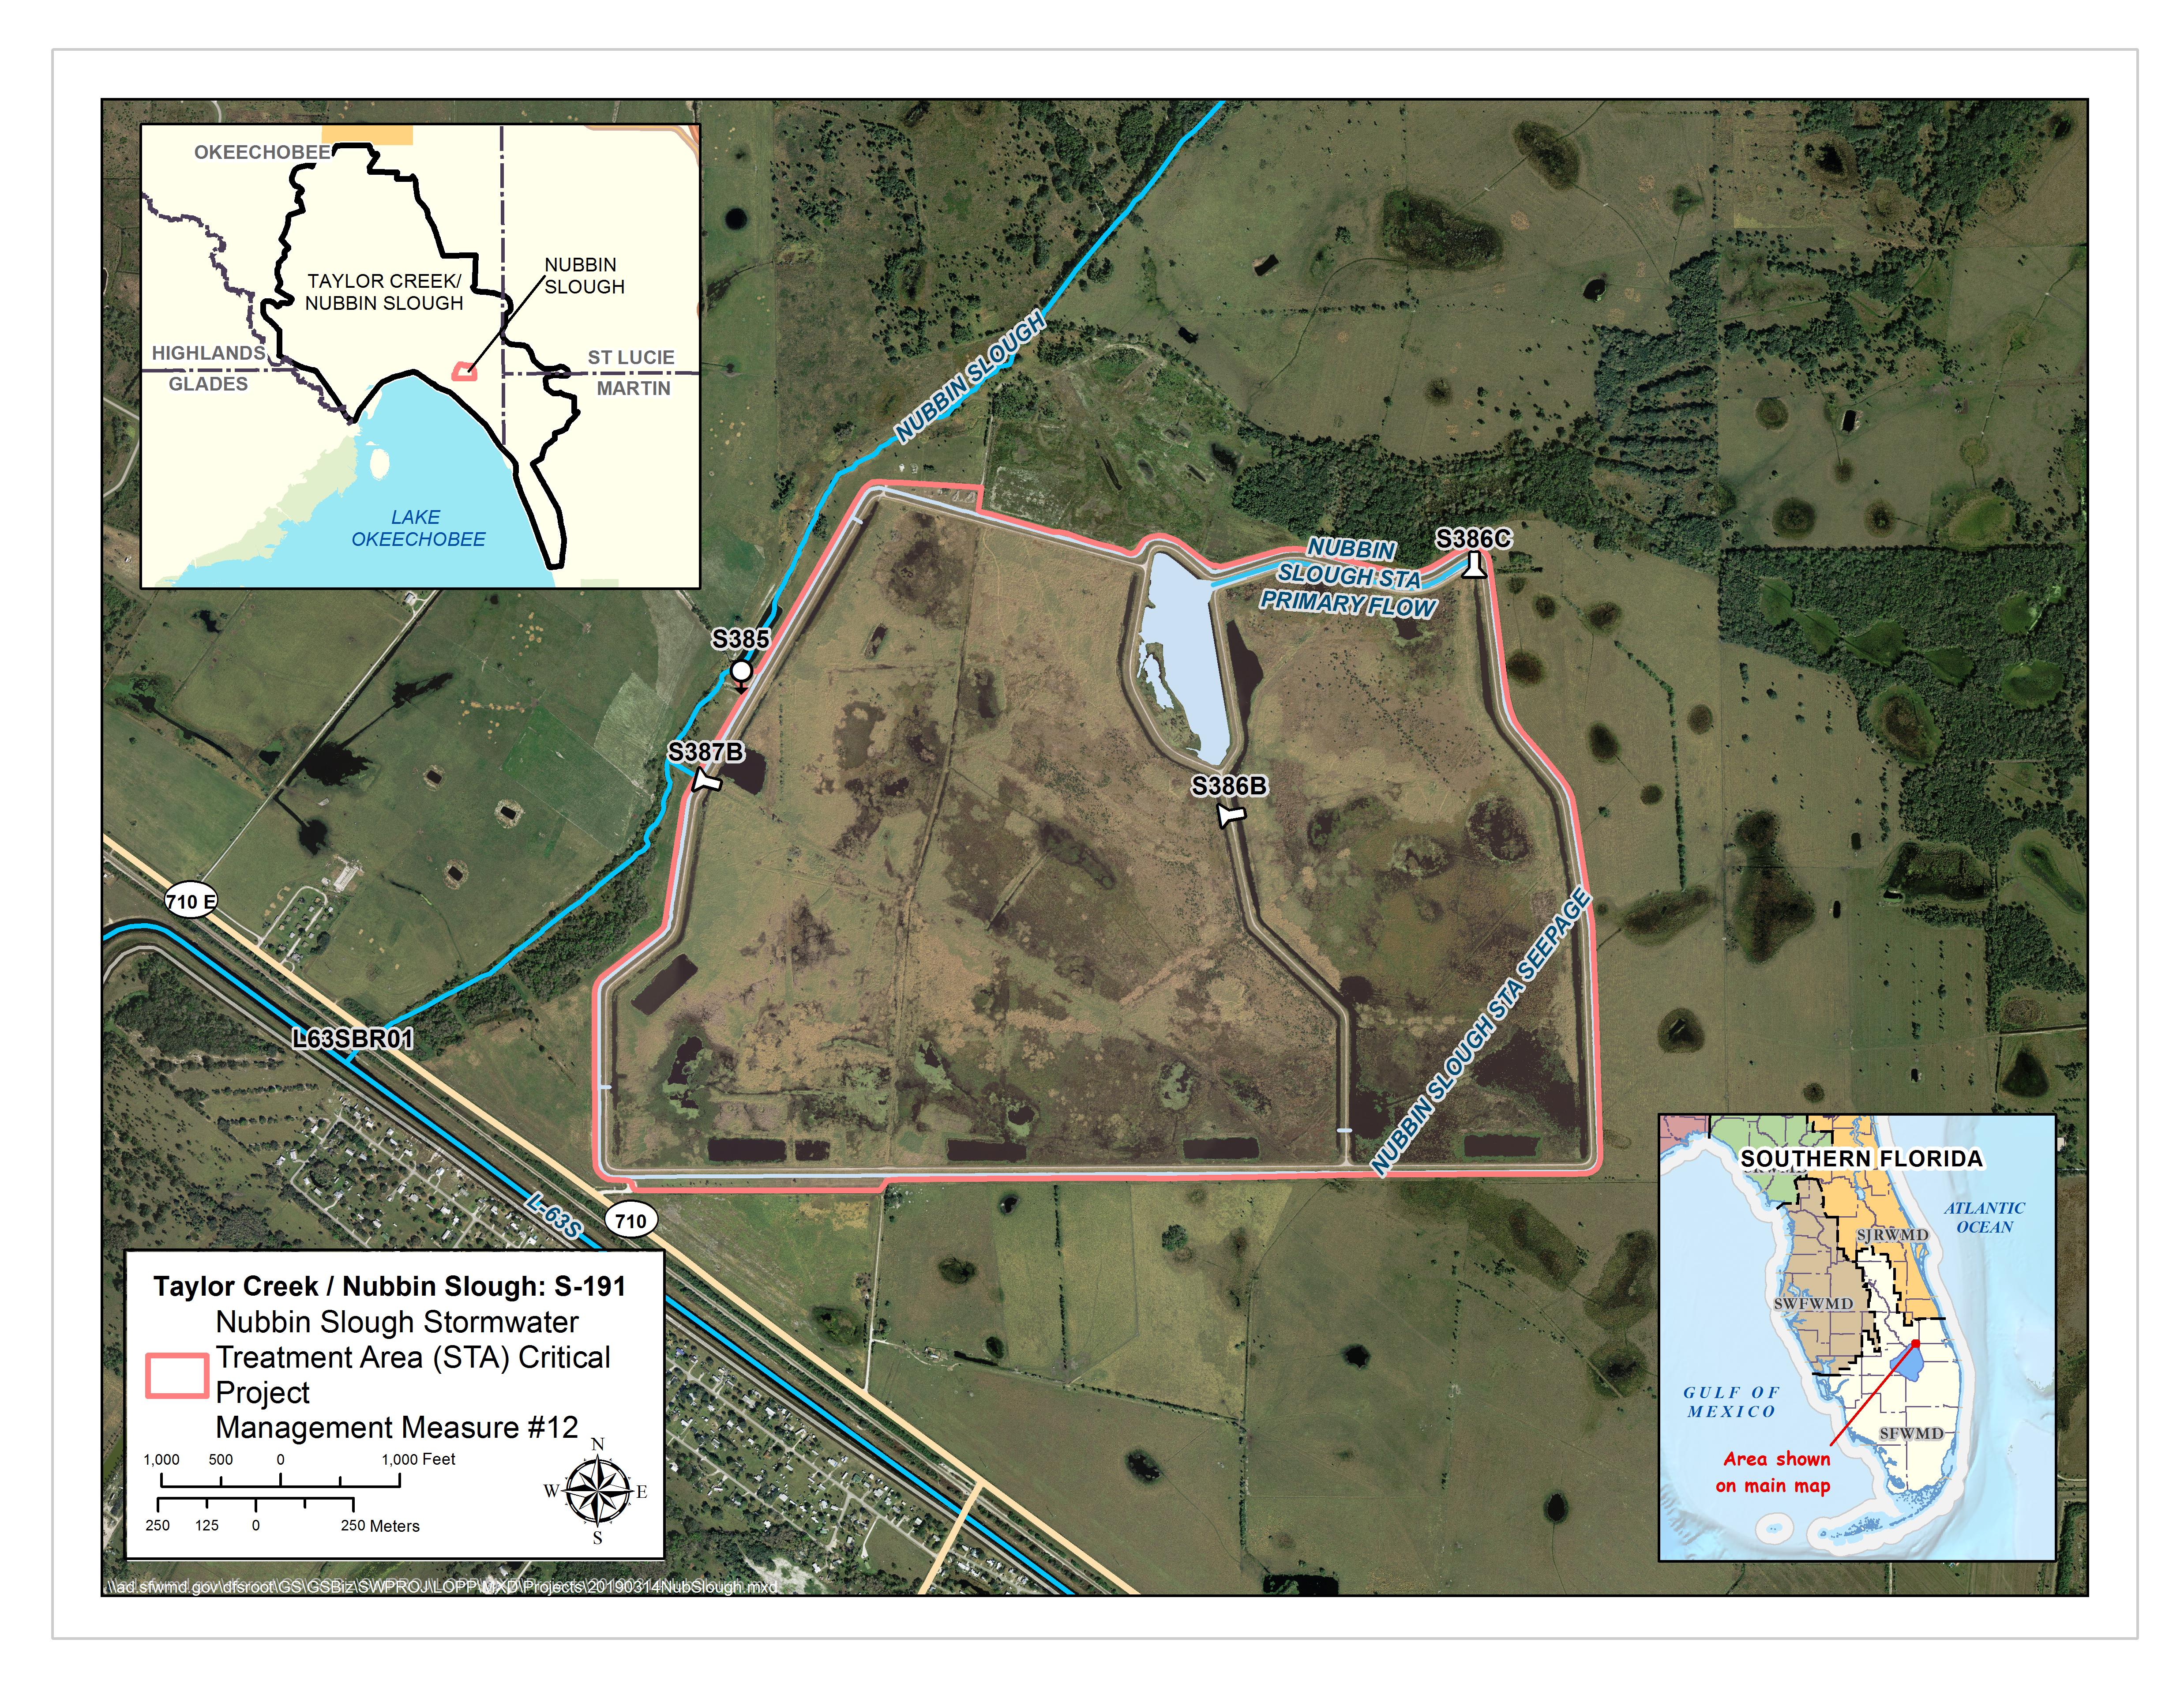 Purpose: The purpose of this STA is to divert and treat runoff from Nubbin Slough. This will be accomplished by pumping water from Nubbin Slough into the STA. Water will then discharge back to the slough through three outlet structures on the west side of Cell 2.
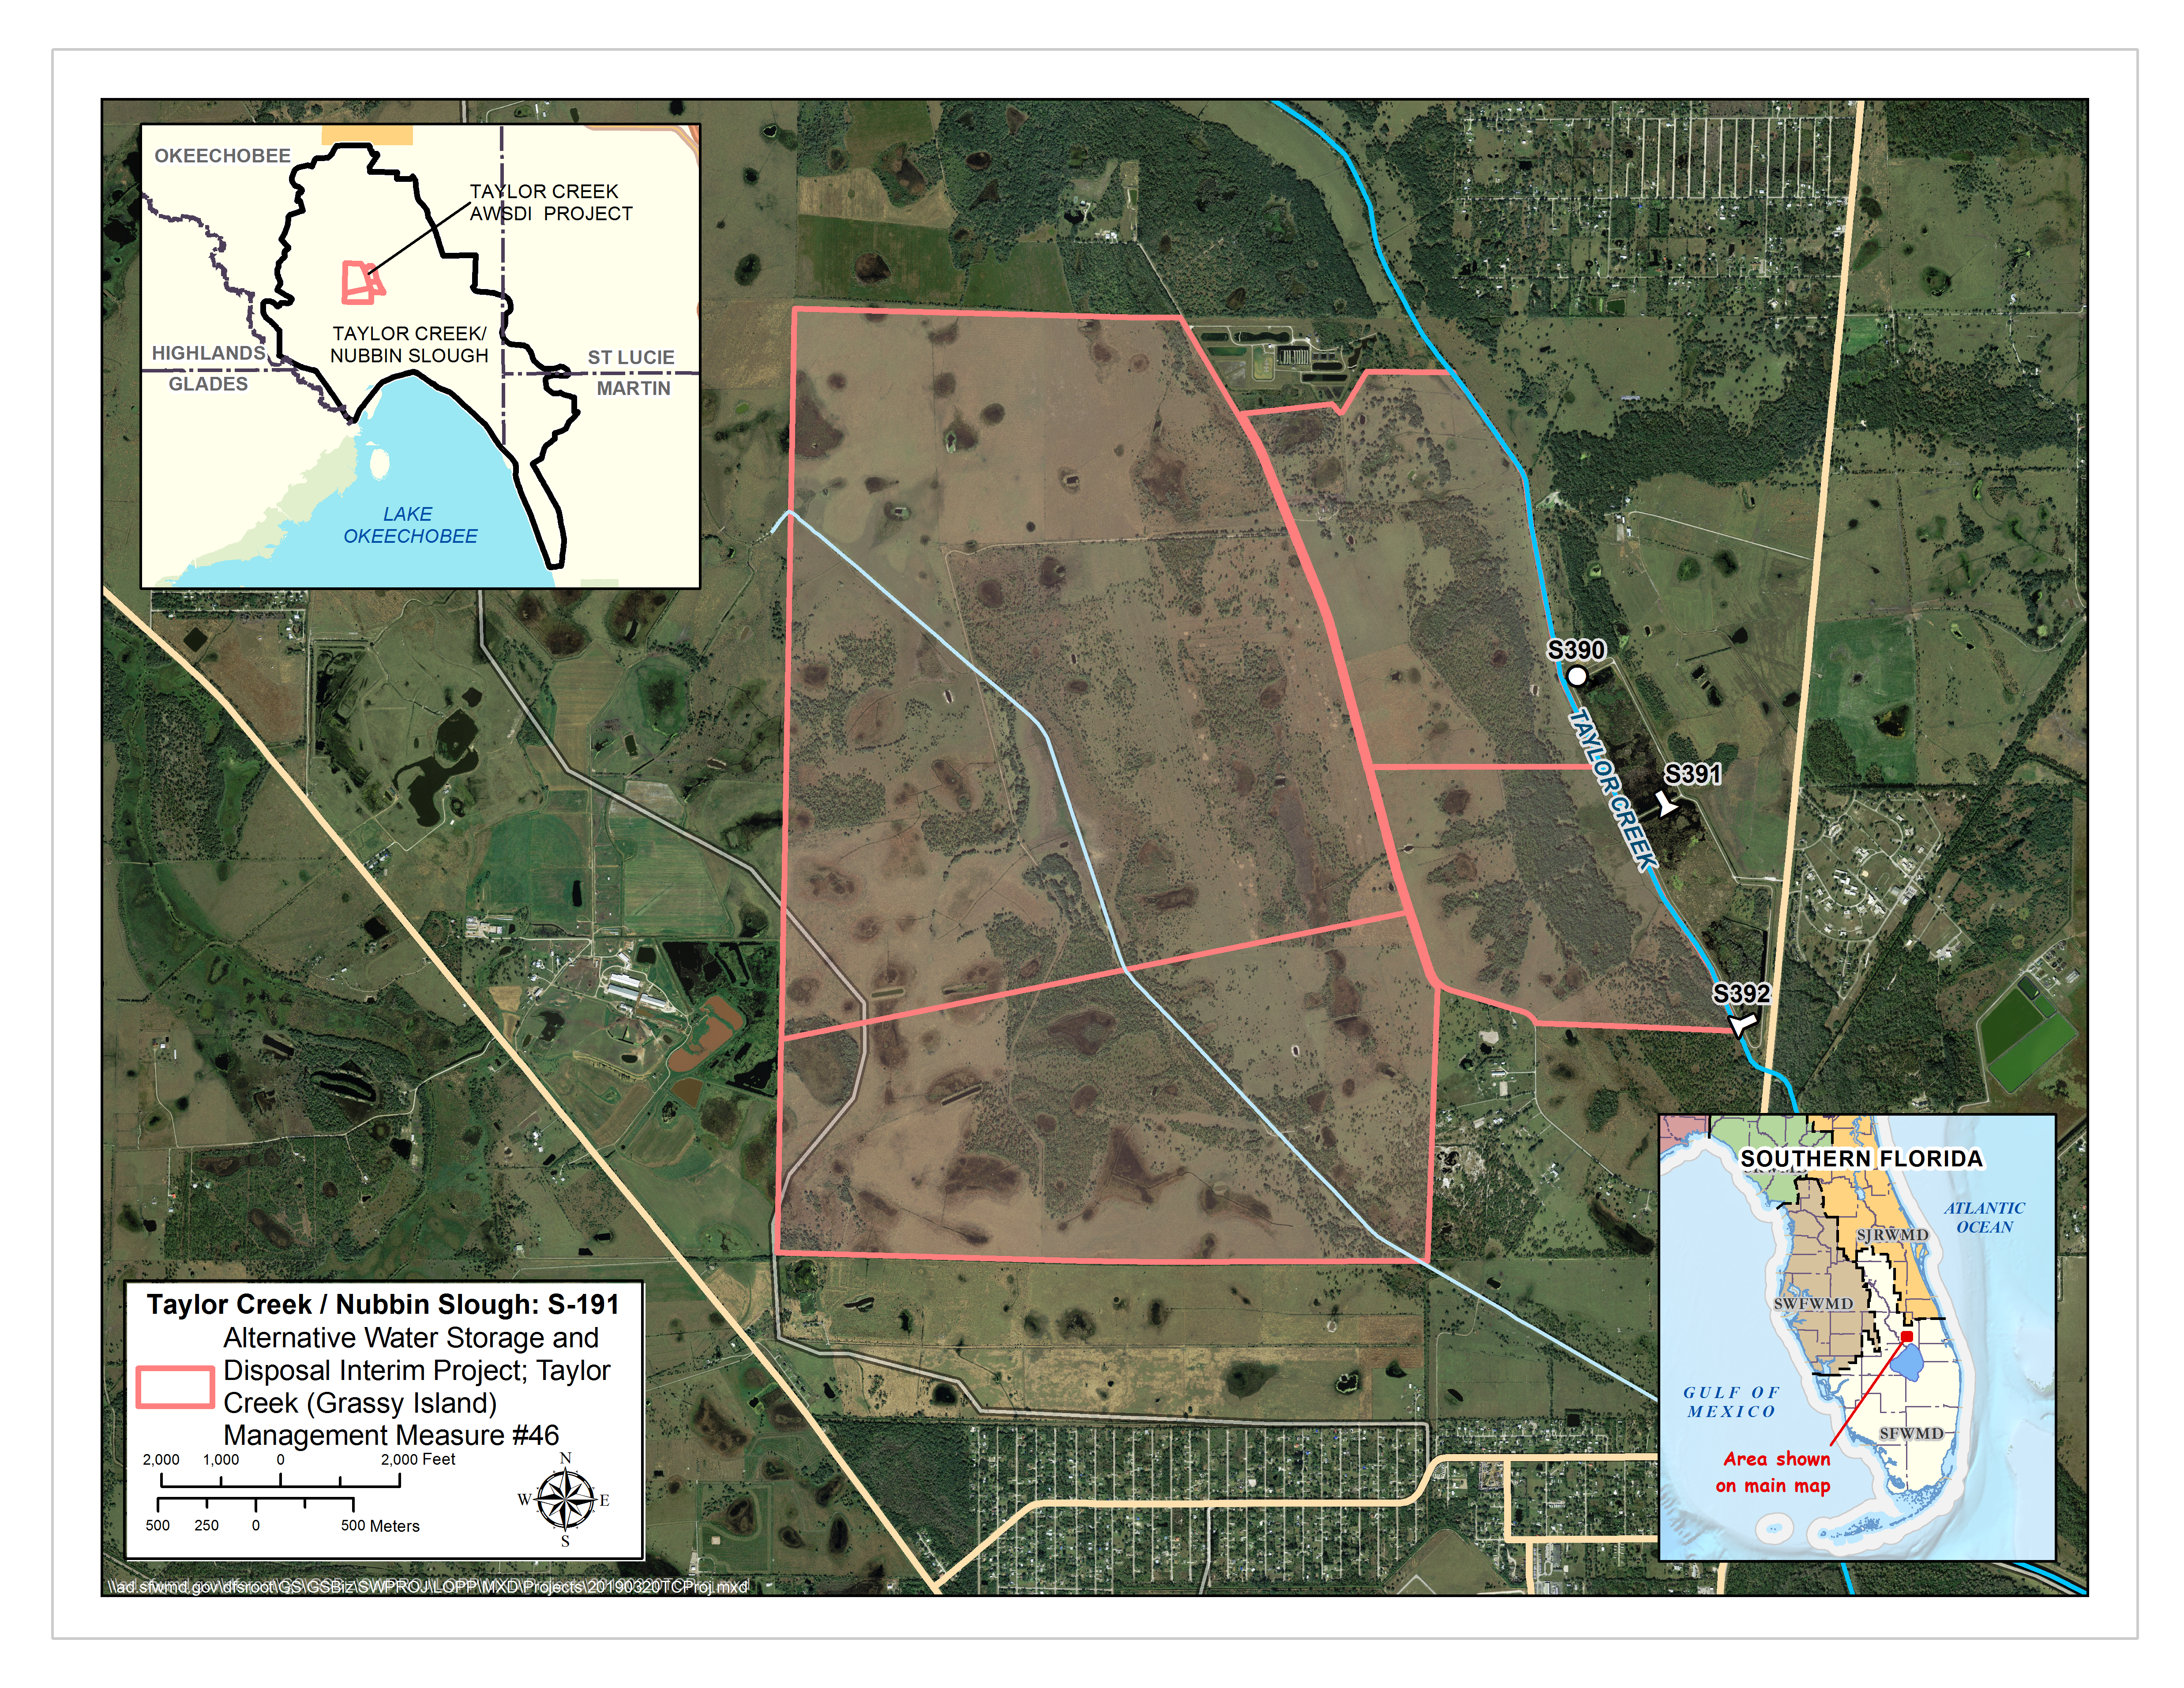 Purpose: Utilize interim facilities for water storage by employing a range of site alternative measures at a number of project sites. Alternatives include construction of on-site measures such as temporary ditch blocks, minor berms, minimal earthwork, wetland restoration, and potential water diversions to the project site using temporary pump facilities.
 Purpose: Treat water and remove phosphorus before it enters Lake Okeechobee. The 1,800-acre STA will receive flows from L-63 and will discharge to Lake Okeechobee.
Purpose: Capture and reduce the amount of total phosphorus from the S-191 and S-135 basins prior to discharge back into the L-47 rim canal and eventually into Lake Okeechobee.
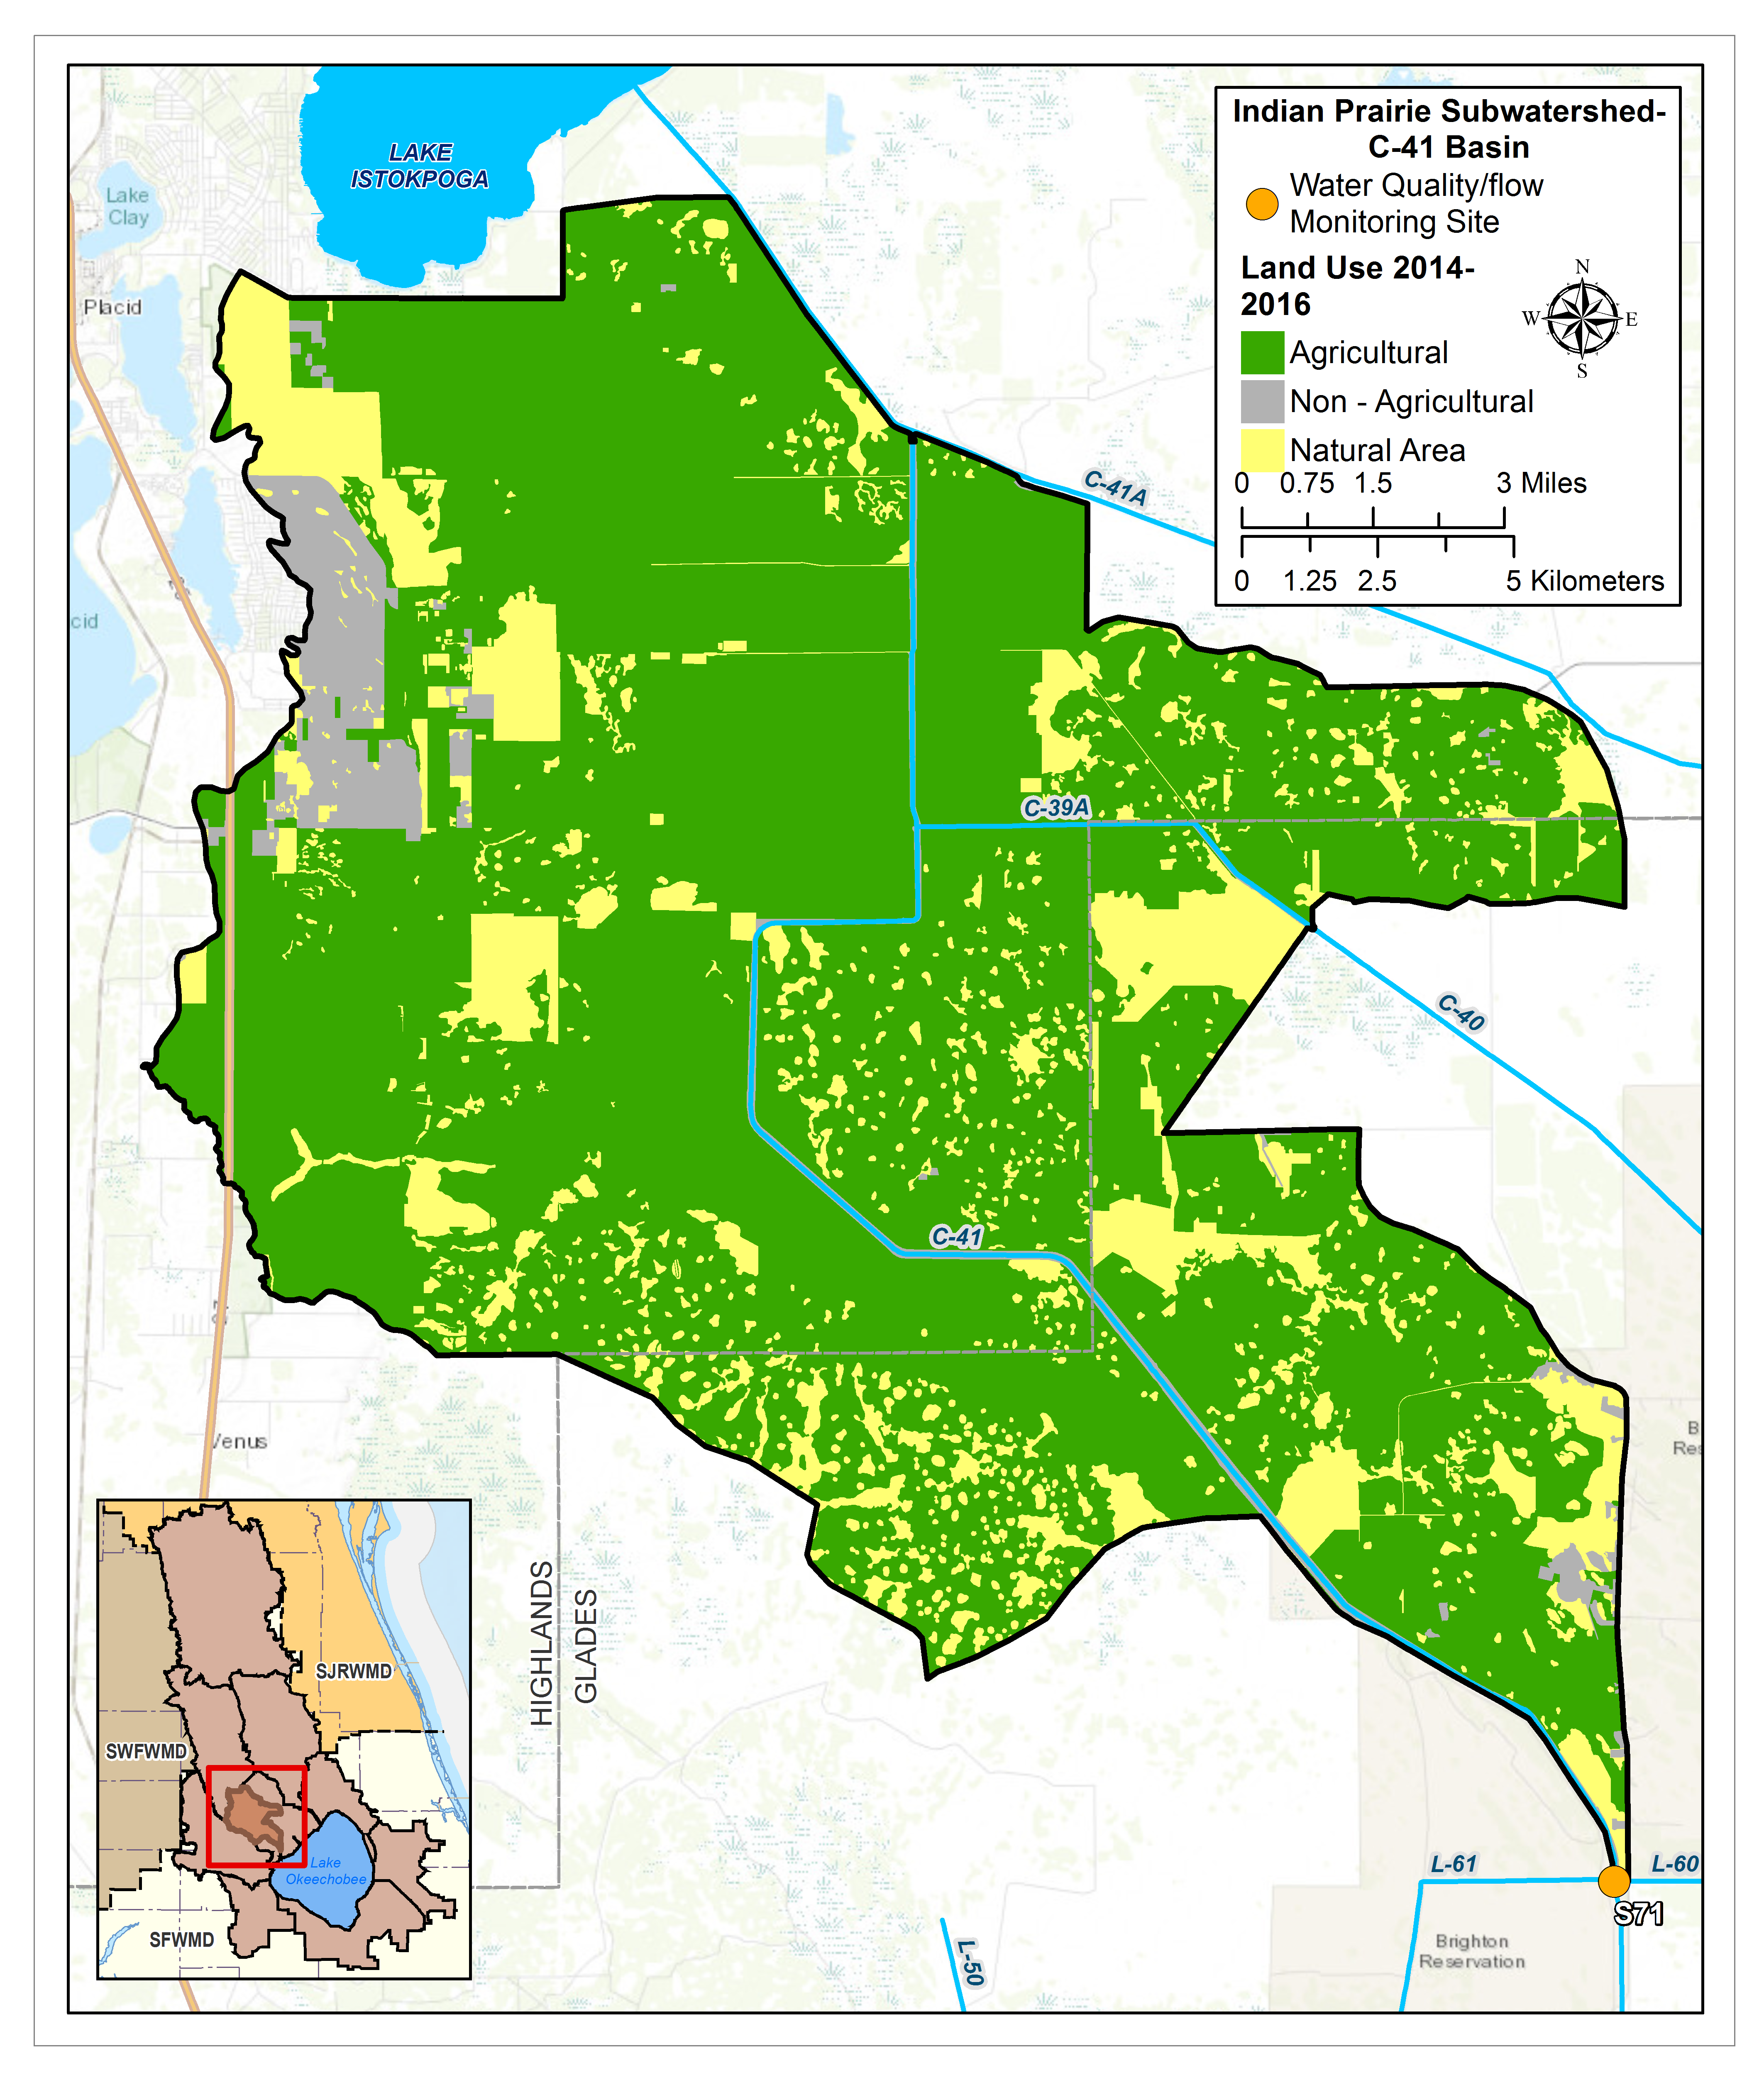
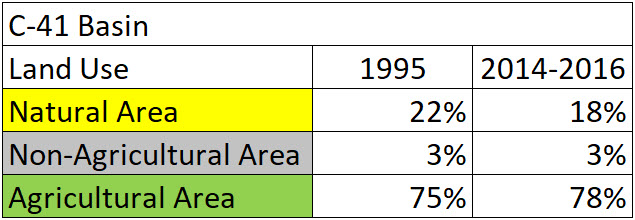
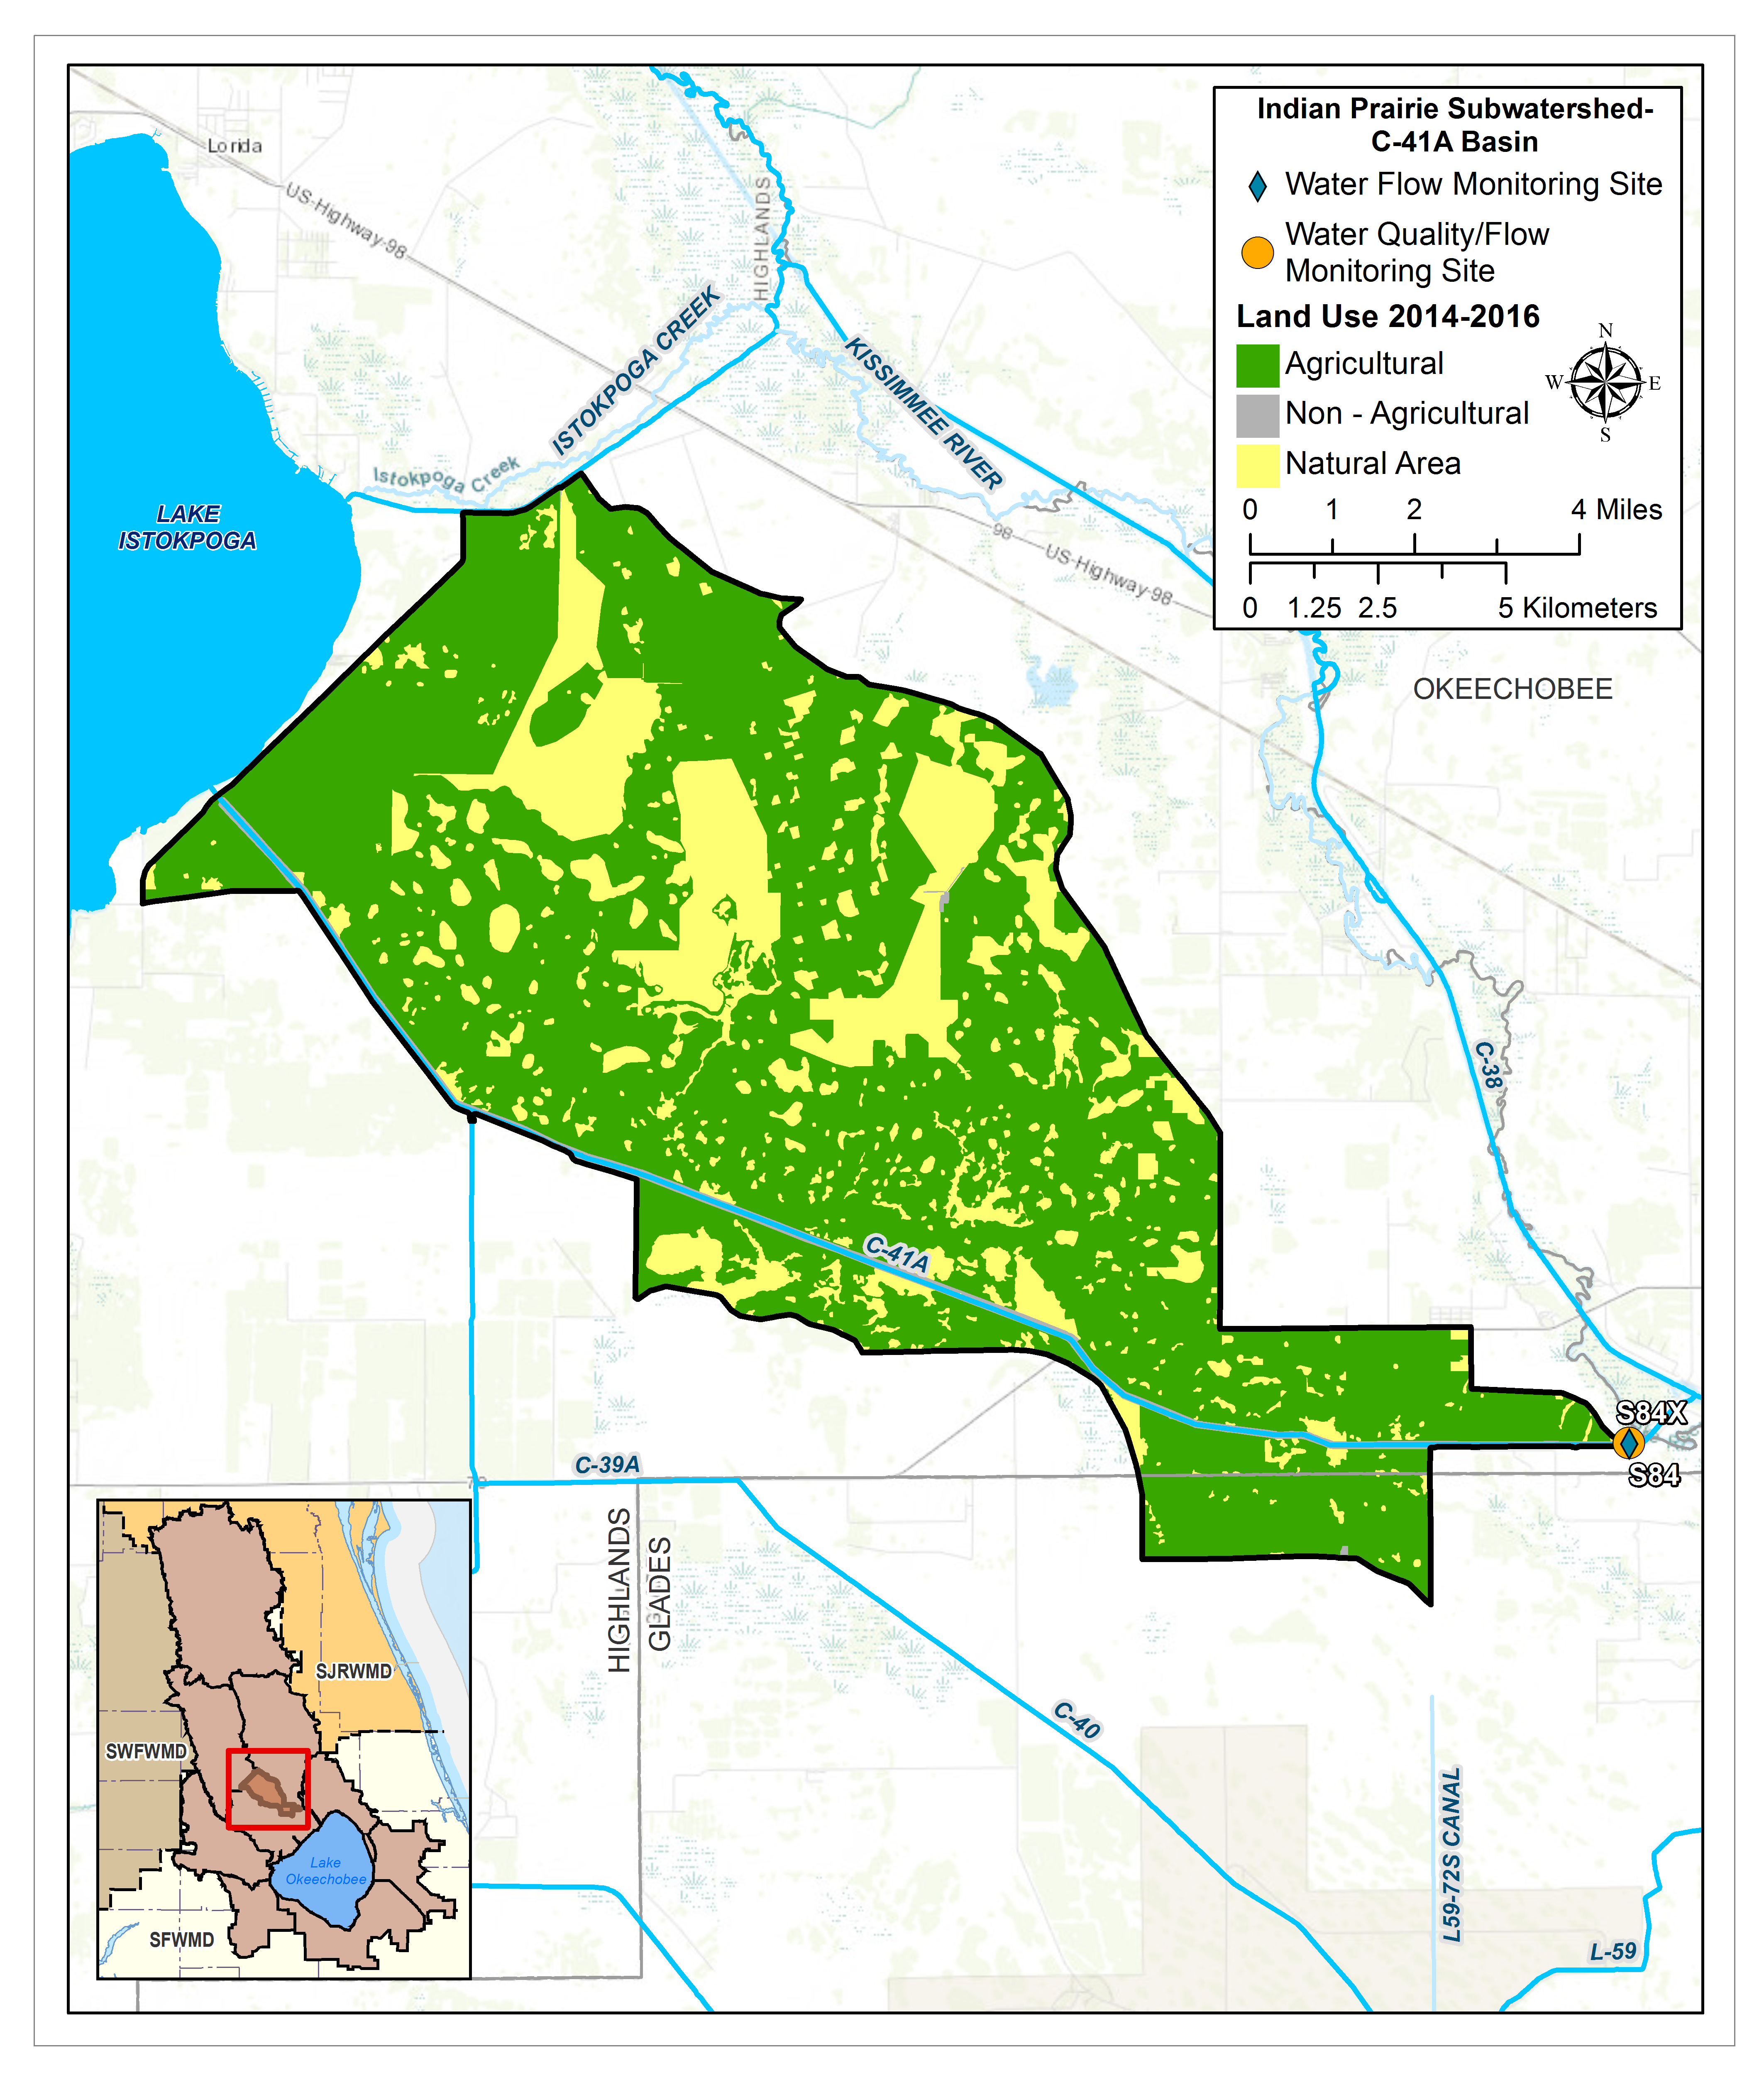
INDIAN PRAIRIE BASINS
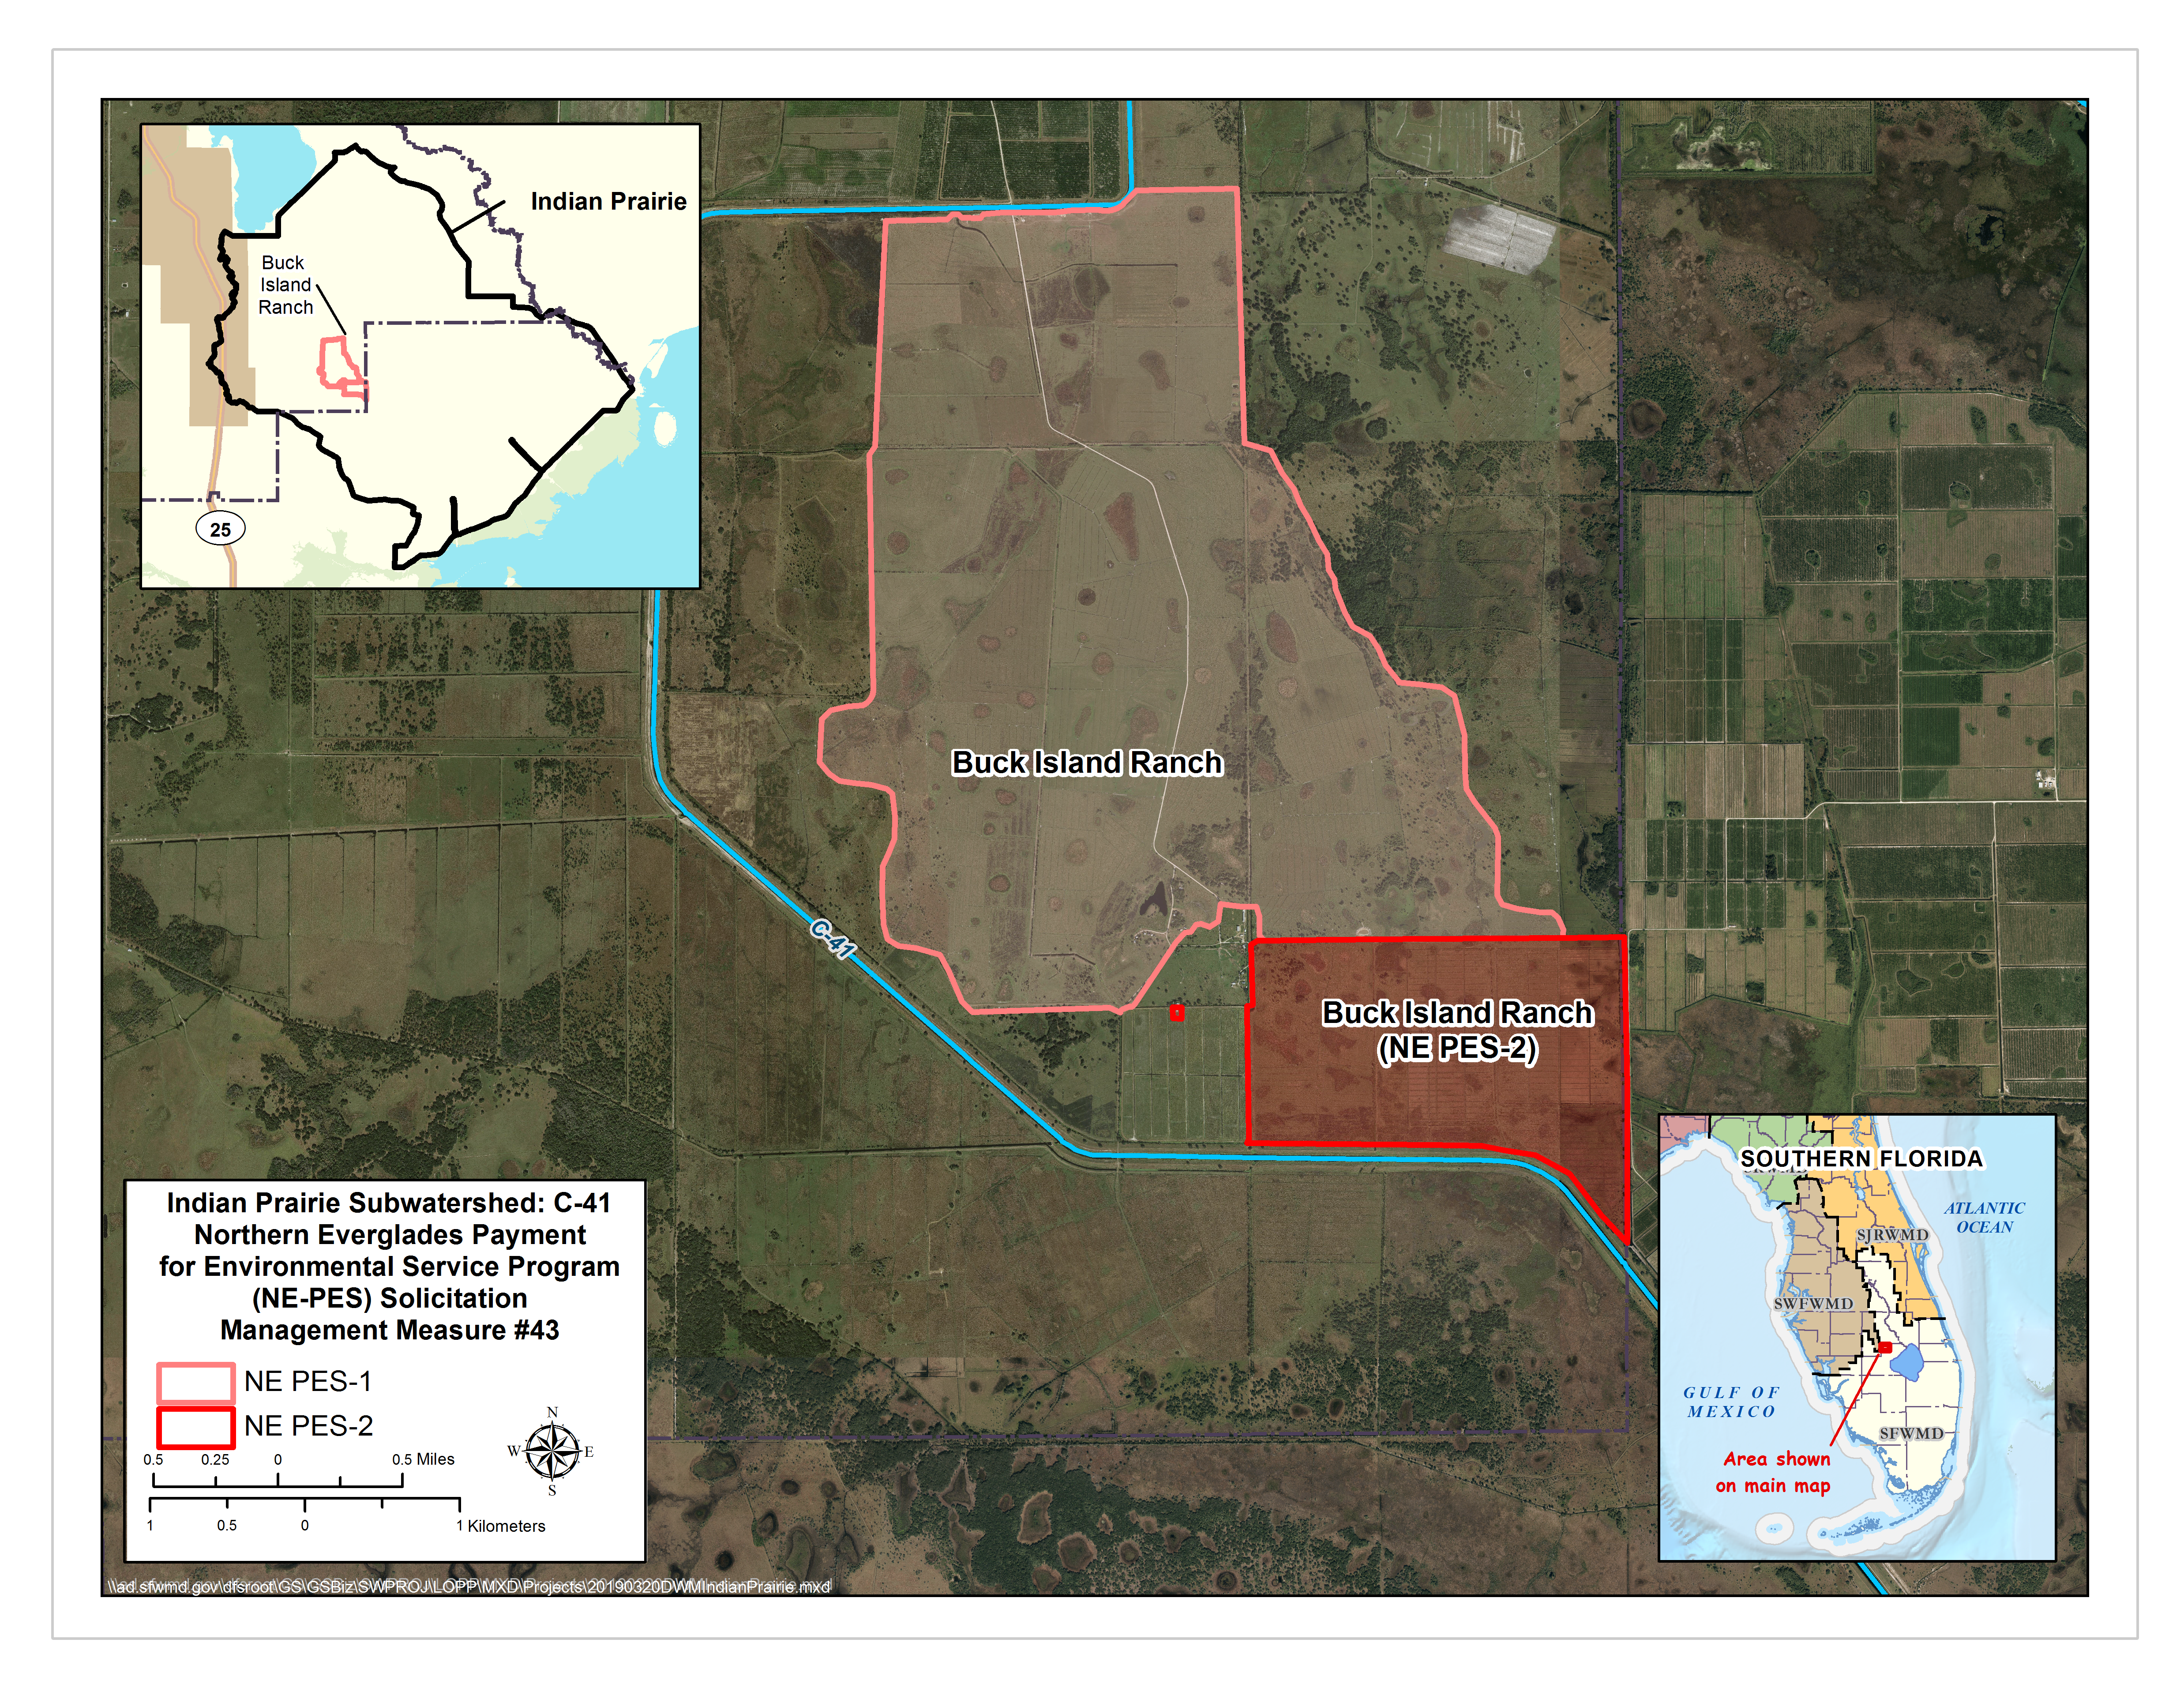
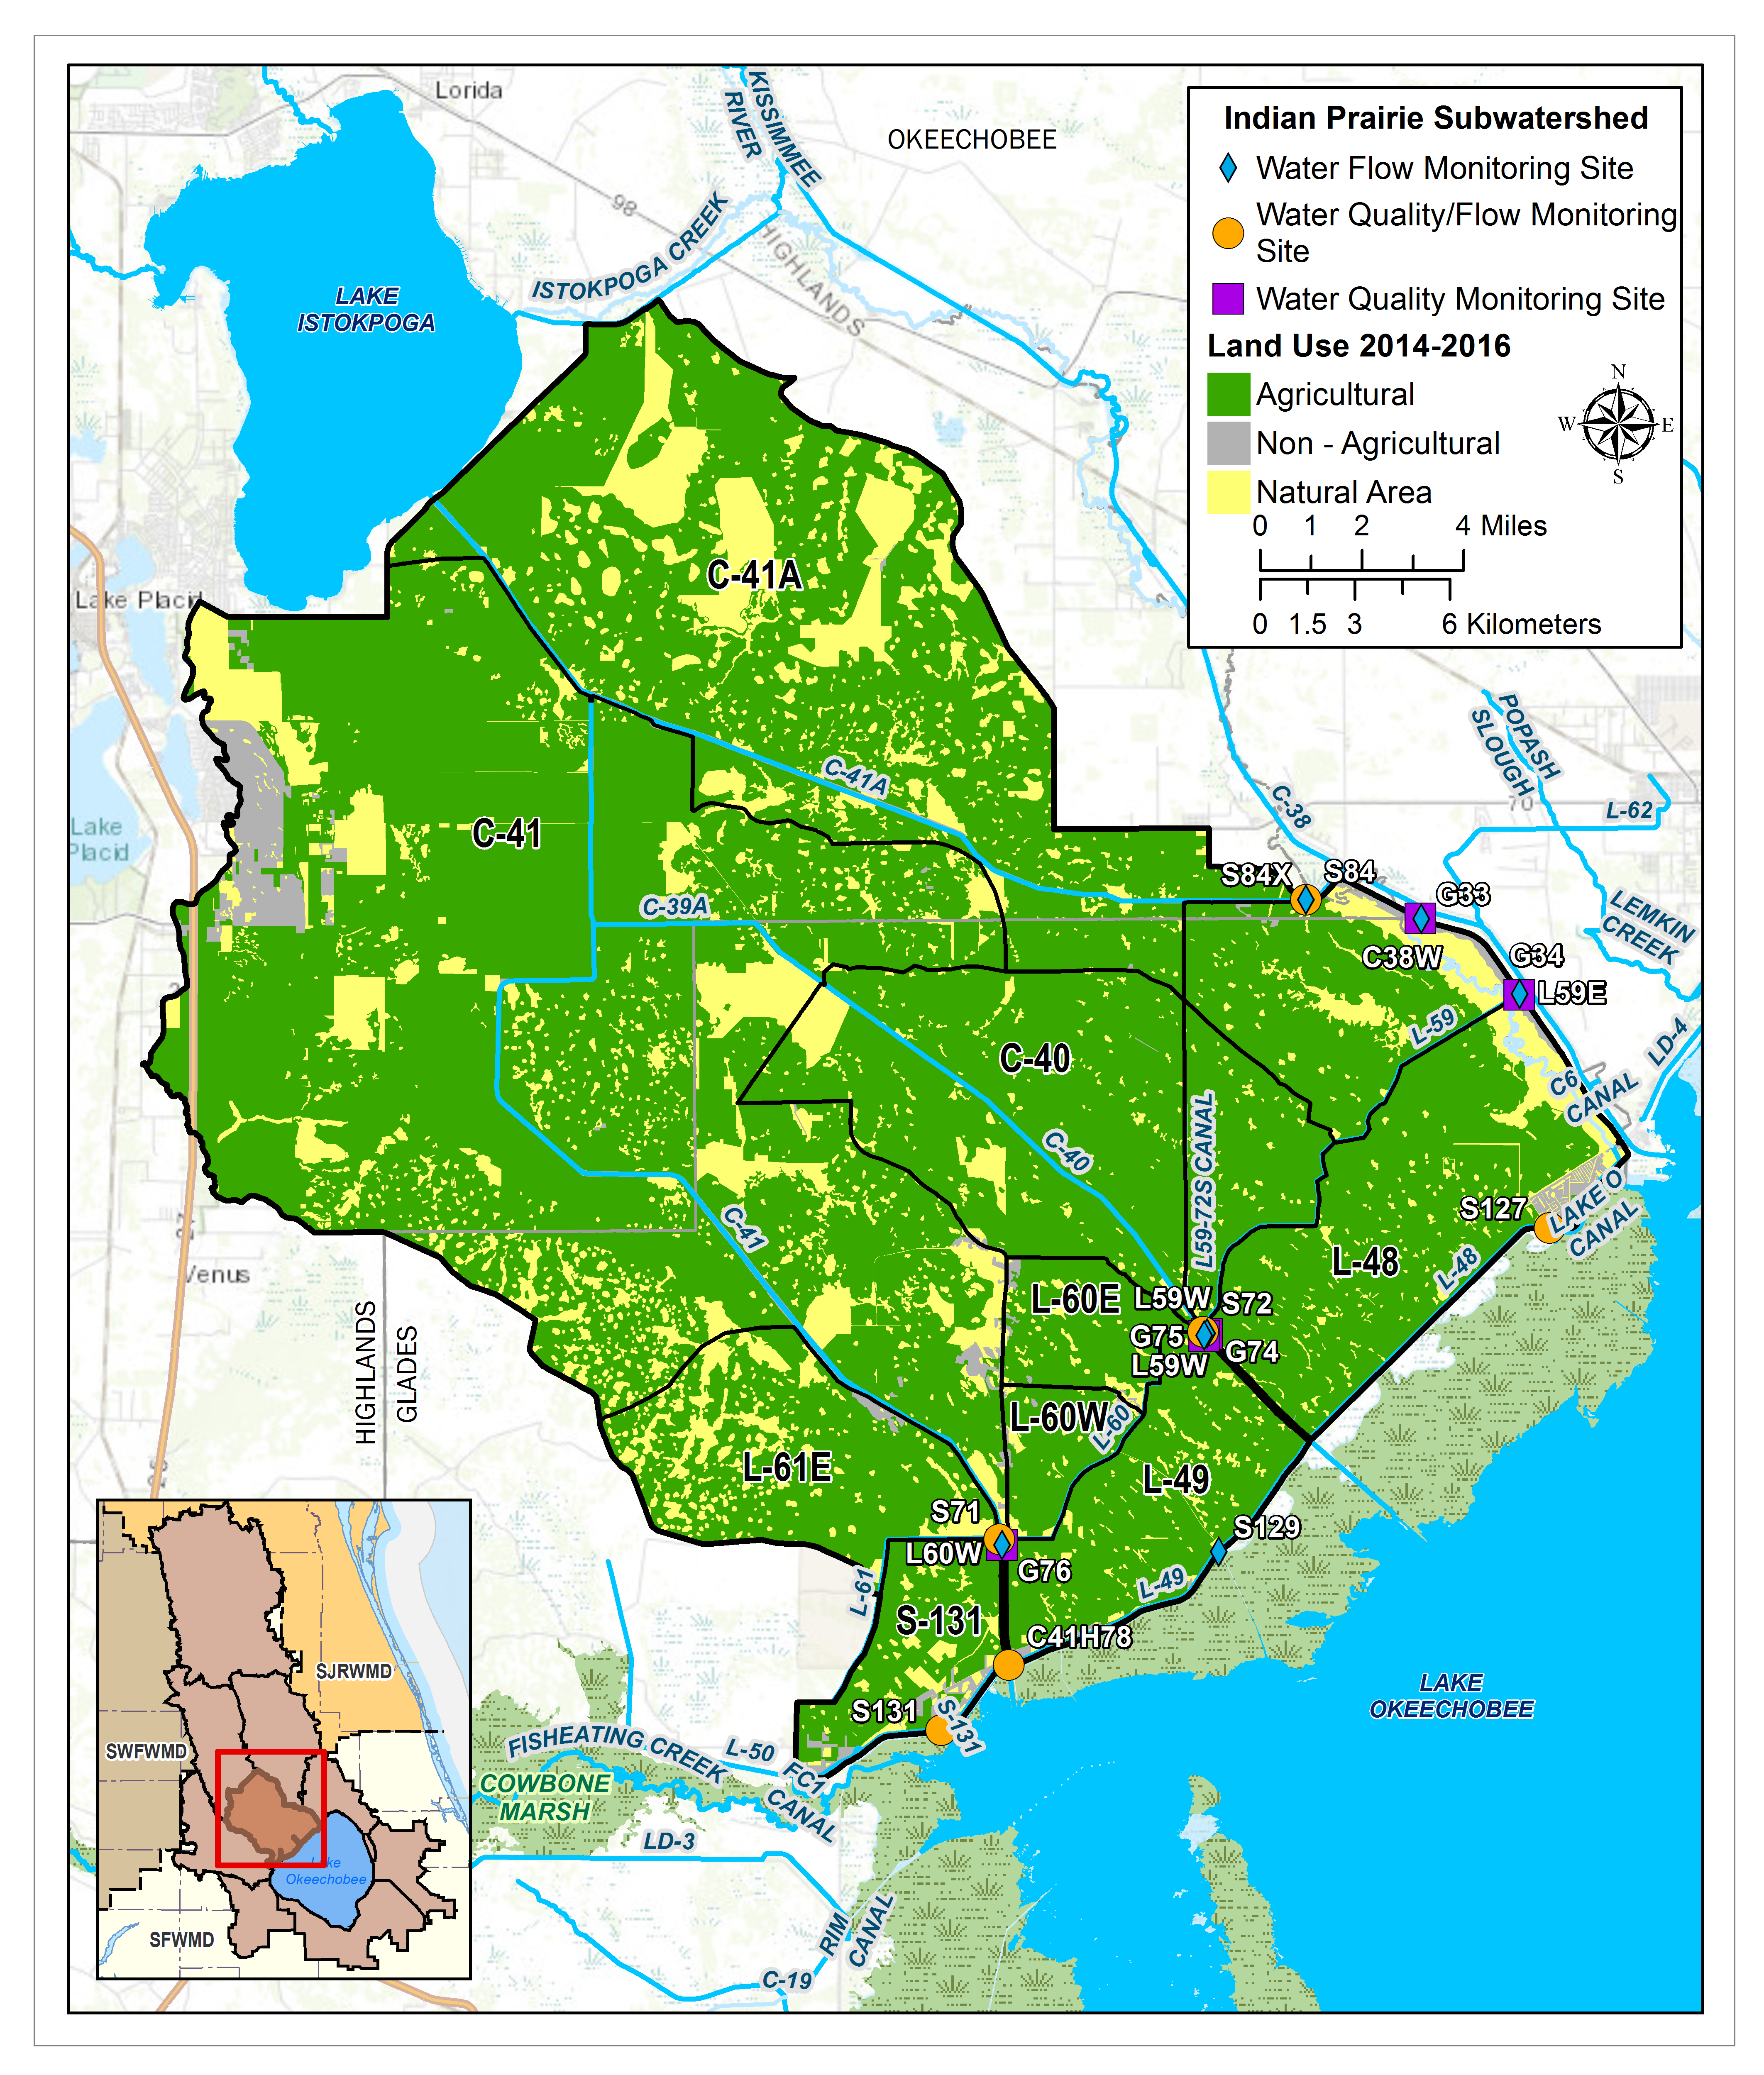
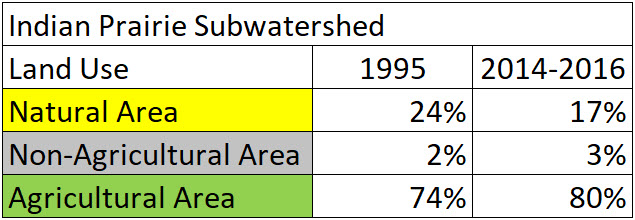
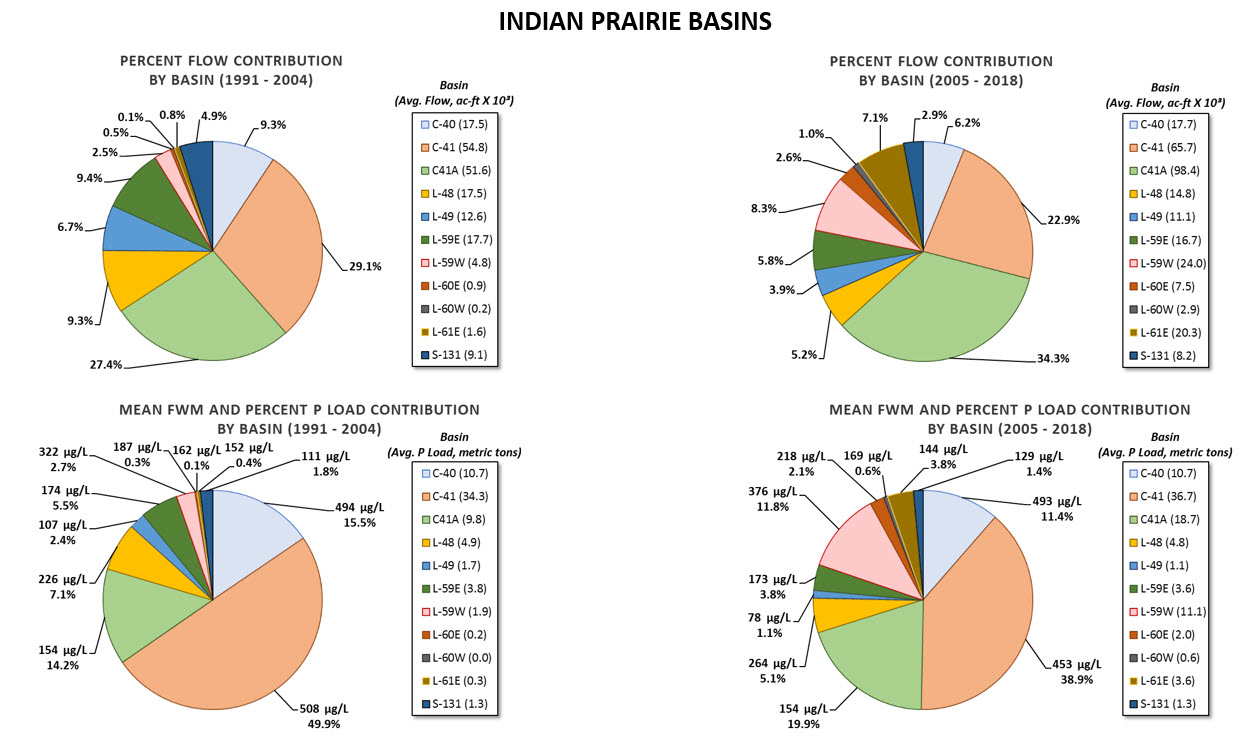
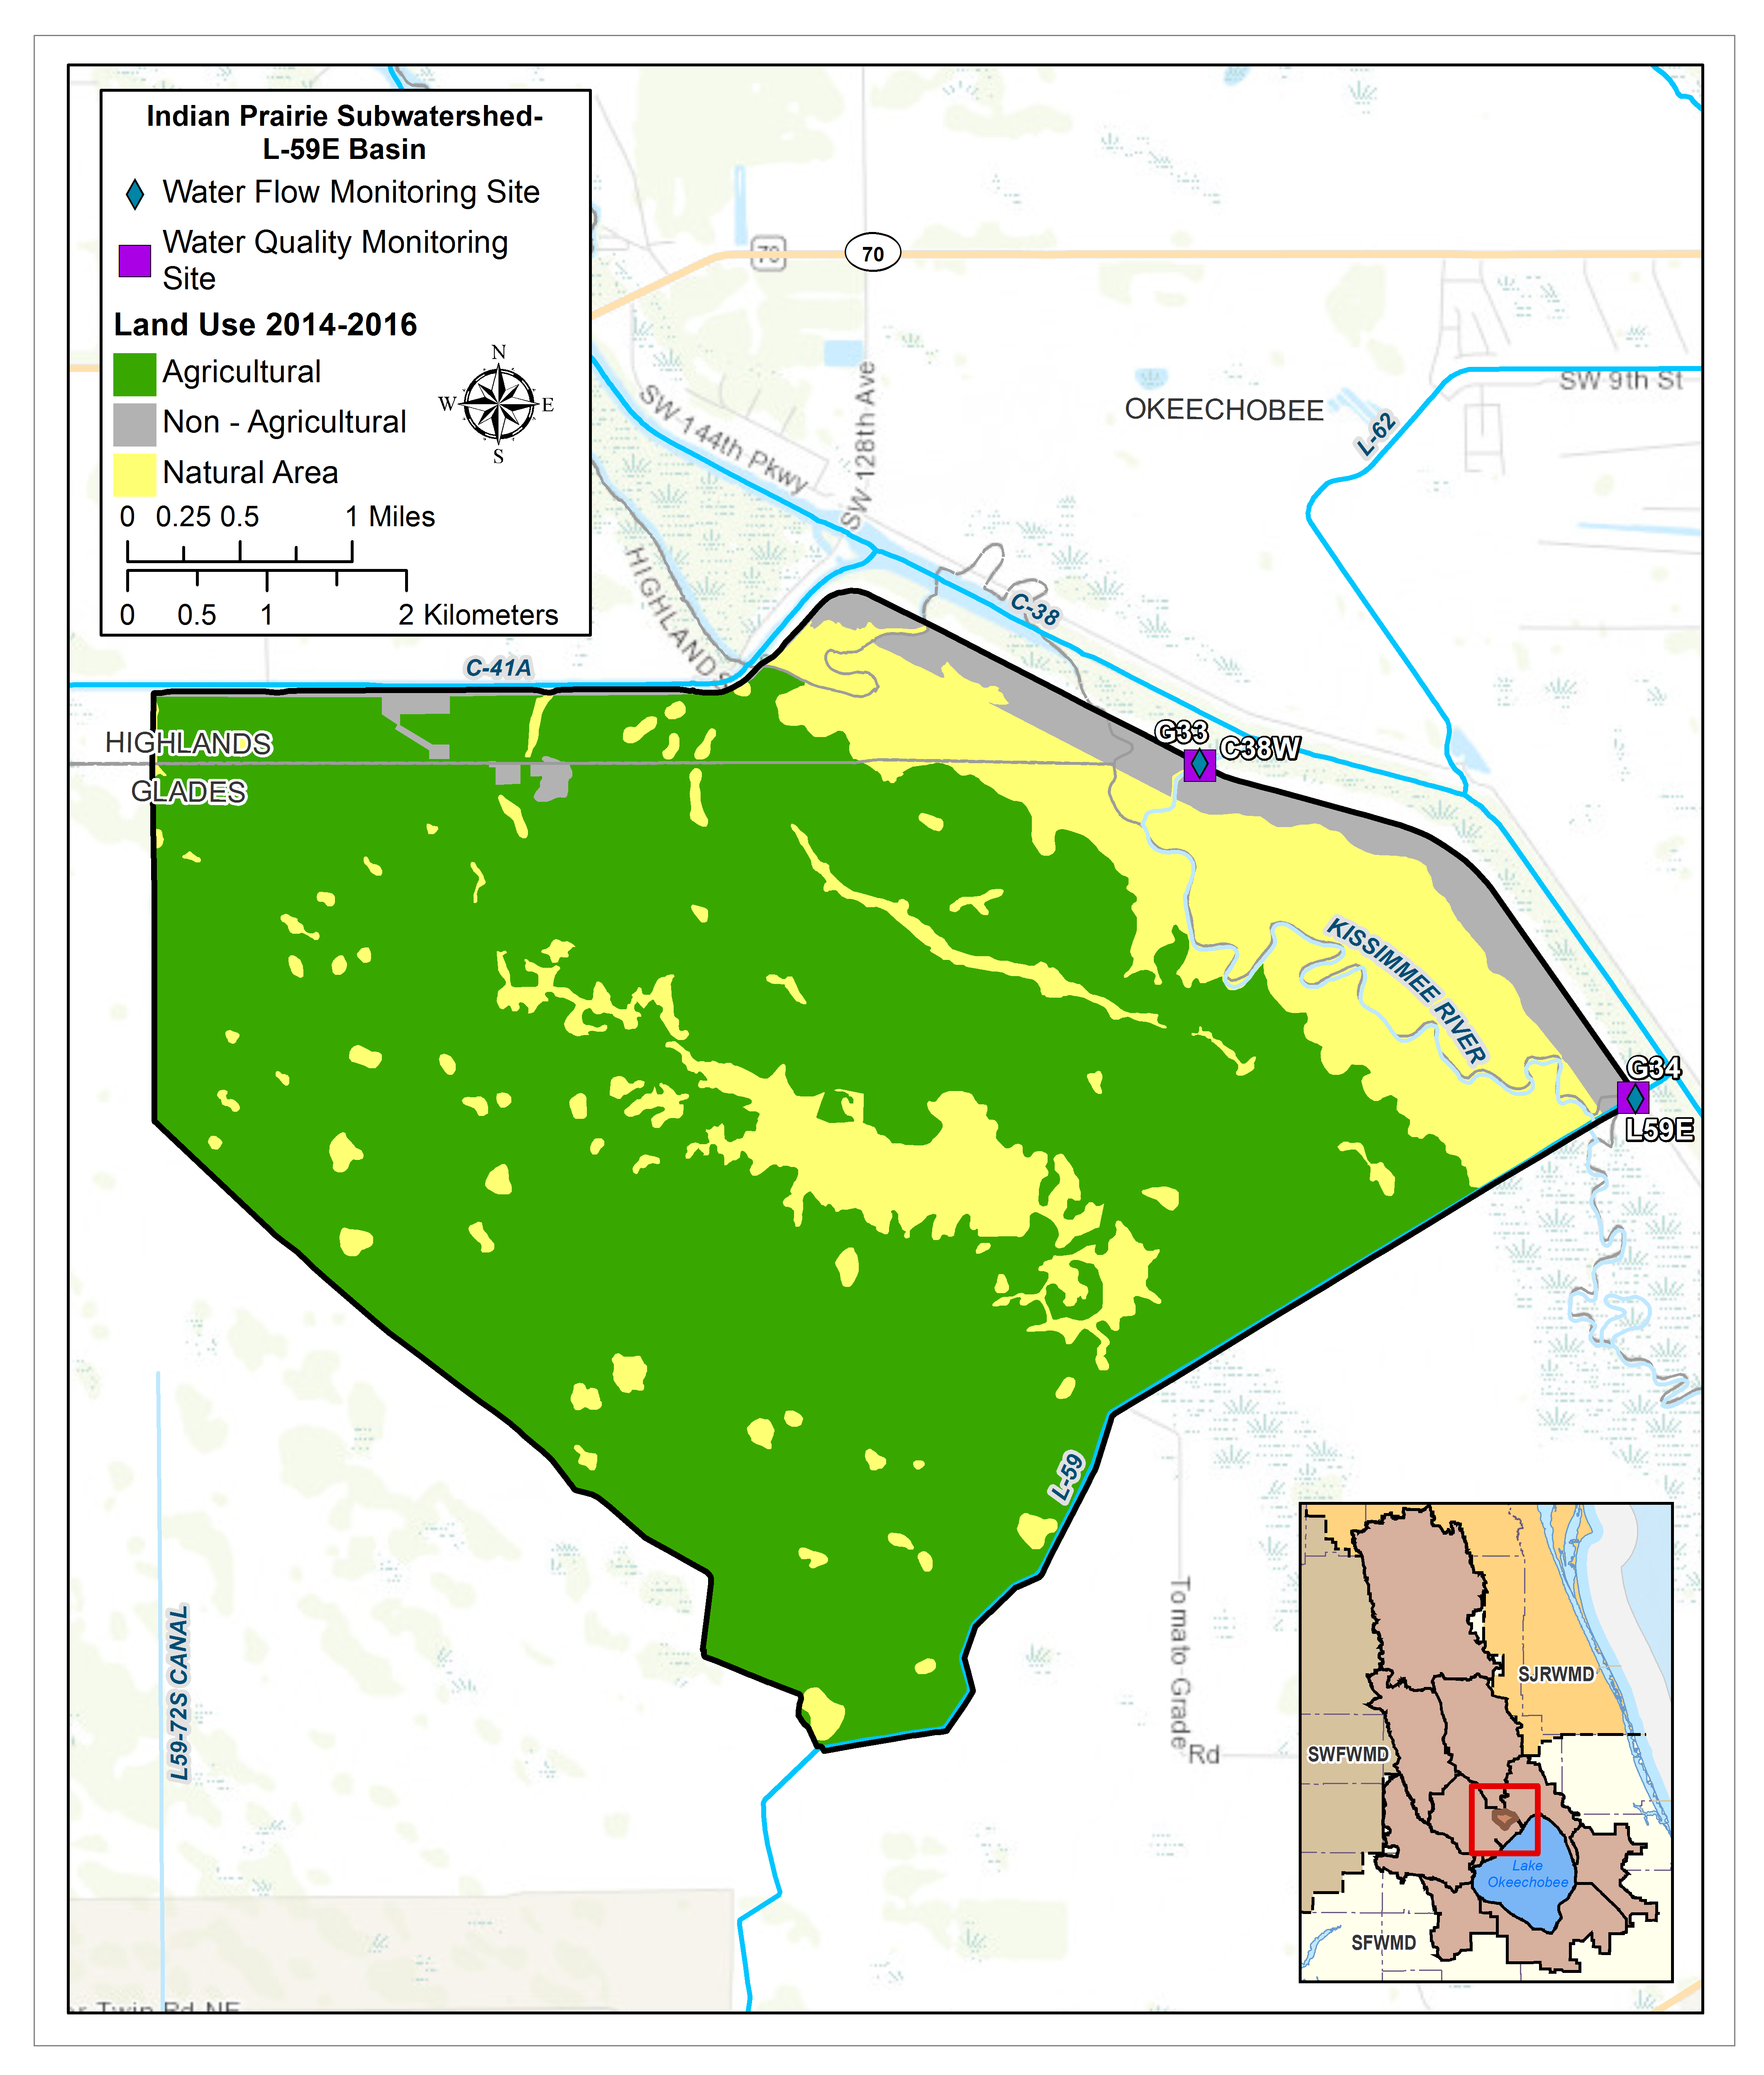
INDIAN PRAIRIE SUBWATERSHED
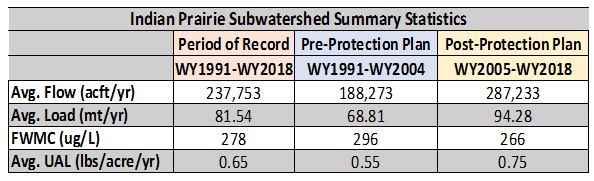
Total Area: 276,577ac
% Area of Lake Okeechobee Watershed: 8.0%
% TP Load of Lake Okeechobee Watershed: 18.1%
Monitoring Locations: S127, S129, S131, S68, S71, S72, S84, S84X, G33, G34, G74, G75, G76, C41H78, C38W/L59E, L59W, L60E, L60W
Flow Issues: Maybe
- Estimated or missing flow measurement data in several basins makes it difficult to evaluate data between the pre and post-protection plan period.
- The flow showed a statistically significant increase between the pre and post-protection plan period. Flow has a statistically significant increasing trend in the post-protection plan period.
- The way flow is calculated throughout this subwatershed raises many questions and more information is needed to determine if the flow measurements are reliable.
- While flow is indicated to be increasing, rainfall data for the subwatershed may help clarify if the increase was due to climatic conditions as well as the previously mentioned flow measurement issues in this subwatershed.
- The proportion of load and flows generated among C-40, C-41, C-41A is not known. It is currently estimated by an algebraic equation.
- May want to look into rainfall relationship over time. Lake inflow for irrigation shouldn't have impact to loads as it ends up back in the watershed.
- Need to determine if there were changes in water management operations in the post-protection plan period resulting in flow increases.
- The increase in flow is not attributed to Lake Istokpoga management.
- Flow and load estimates were based on major structure values to the lake which did not include irrigation.
Water Quality Issues: Yes
- Although the Seasonal Kendall Tau results for total phosphorus (TP) flow-weighted mean concentrations (FWMC) has a statistically significant decreasing trend in the post-protection plan period, the amount of reduction is small (~3% per year) and the post-period TP FWMC remains relatively high at 266 μg/L.
- There is a greater variability in the range of concentrations in pre-period and less variability in post period FWMC data which results in the statistically significant decreasing trend in FWMC for the post period.
- The 18% contribution of TP loads to the watershed indicates a WQ issue.
- The TP load and UAL increased from the pre to the post-protection plan period.WQ for the subwatershed appears to be impacted the most (70%) by 3 of its 11 basins C-40, C-41, C-41A.
>>Additional Technical Information
PROJECTS LOCATED IN THIS SUBWATERSHED
 Purpose: Utilize interim facilities for water storage by employing a range of site alternative measures at a number of project sites. Alternatives include construction of on-site measures such as temporary ditch blocks, minor berms, minimal earthwork, wetland restoration, and potential water diversions to the project site using temporary pump facilities.
Purpose: Utilize interim facilities for water storage by employing a range of site alternative measures at a number of project sites. Alternatives include construction of on-site measures such as temporary ditch blocks, minor berms, minimal earthwork, wetland restoration, and potential water diversions to the project site using temporary pump facilities.
Purpose: Utilize interim facilities for water storage by employing a range of site alternative measures at a number of project sites. Alternatives include construction of on-site measures such as temporary ditch blocks, minor berms, minimal earthwork, wetland restoration, and potential water diversions to the project site using temporary pump facilities.
Purpose: Provide additional water quality improvements in the Indian Prairie subwatershed.
Purpose: Enhance existing storage and capacity and provide additional water quality improvements in the Lake Okeechobee Watershed.
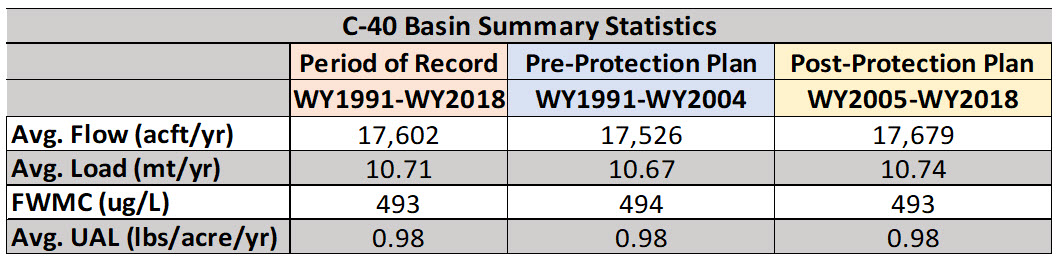
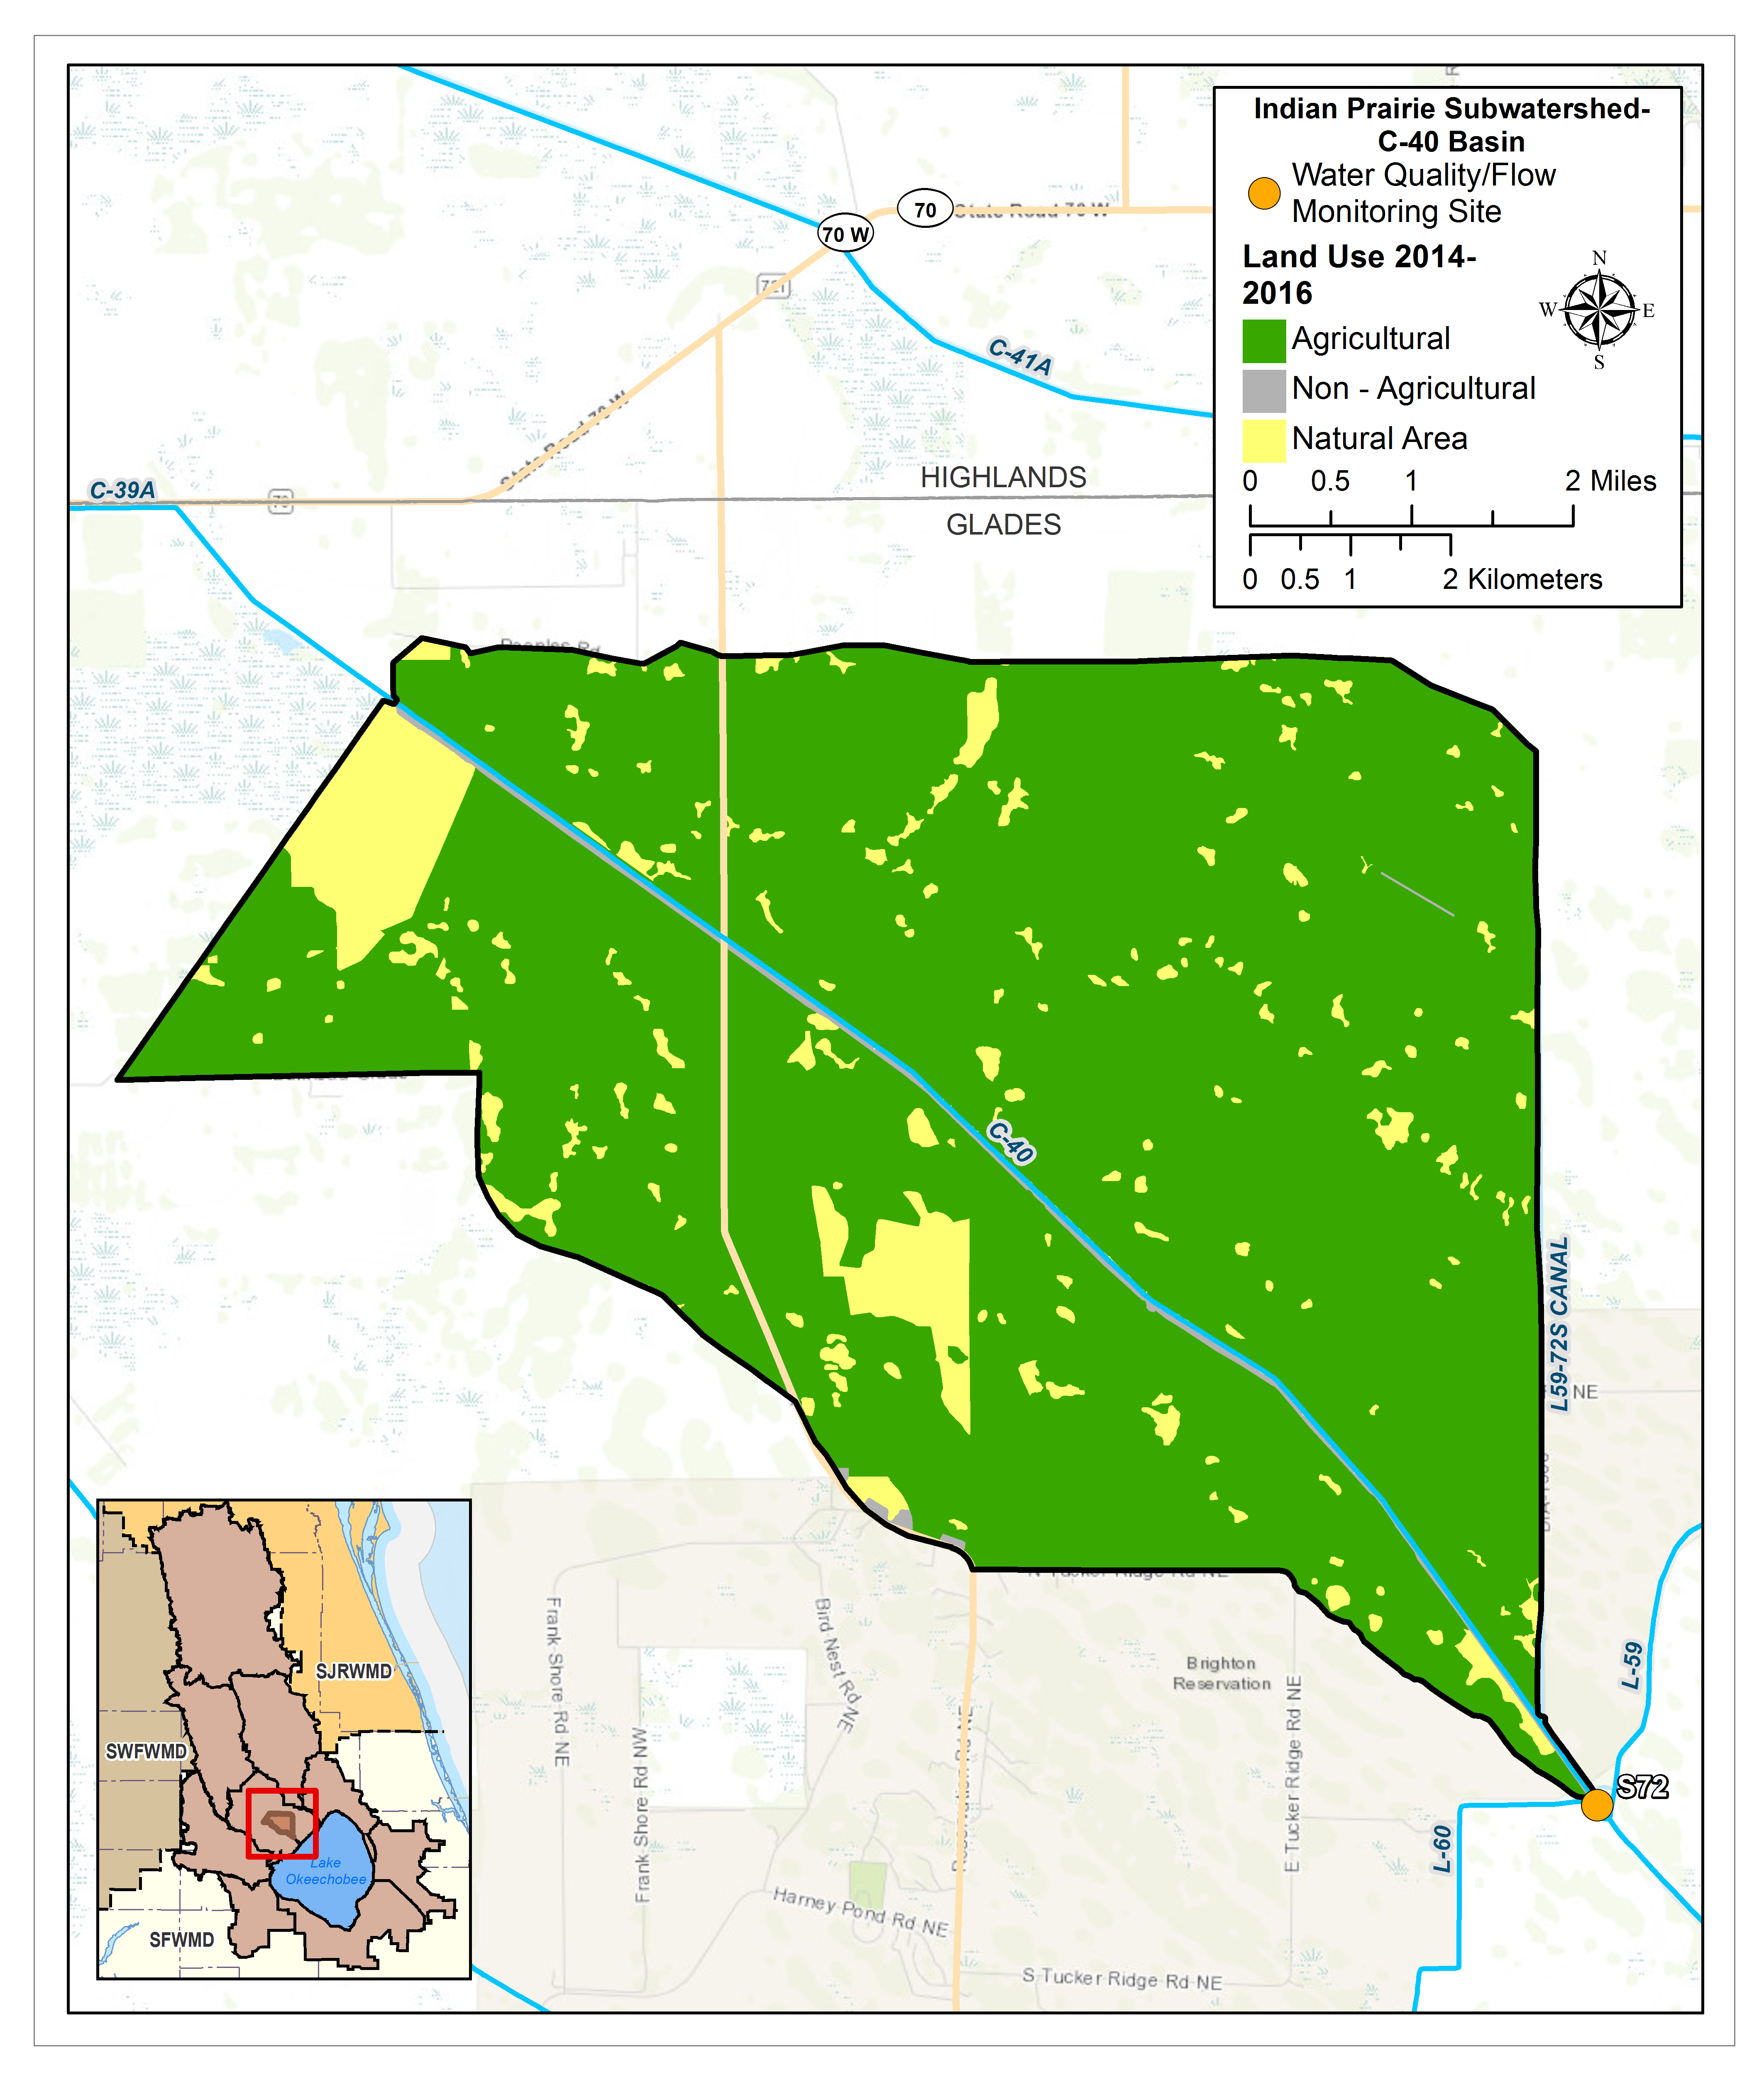
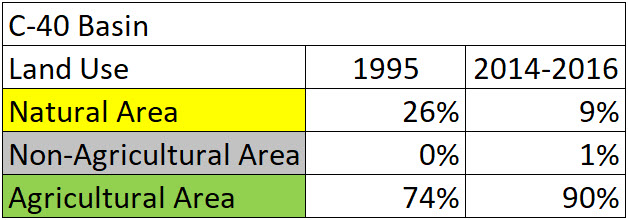
C40 BASIN
Total Area: 24,076ac
% Area of Subwatershed: 9%
% TP Load of Lake Okeechobee Watershed: 11%
Monitoring Locations: S72
Flow Issues: No
- The proportion of load and flows generated among C-40, C-41, C-41A is not known. It is currently estimated by an algebraic equation.
- Flow has slightly increased (not significantly) between pre and post-protection plan periods.
- Flow has a statistically significant increasing trend in the post-protection plan period.
- Although there has been a slight increase in flow and load, this basin is a small contributor to the subwatershed relative to other basins (6% of flows).
- Flow and load estimates were based on major structure values to the lake which did not include irrigation
Water Quality Issues: Yes
- The total phosphorus (TP) load has a statistically significant increasing trend in the post-protection plan period.
- The TP flow-weighted mean concentrations (FWMC) was high relative to other areas with little change between pre and post-protection plan periods (494 μg/L to 493 μg/L).
>>Additional Technical Information
PROJECTS LOCATED IN THIS BASIN
 Purpose: Provide shallow storage, retention and detention to enhance Lake Okeechobee and estuary health by reducing discharge volumes, reducing nutrient loading to downstream receiving waters, and expanding groundwater recharge opportunities.
C41 BASIN
Total Area: 112,880ac
% Area of Subwatershed: 41%
% TP Load of Lake Okeechobee Watershed: 39%
Monitoring Locations: S71
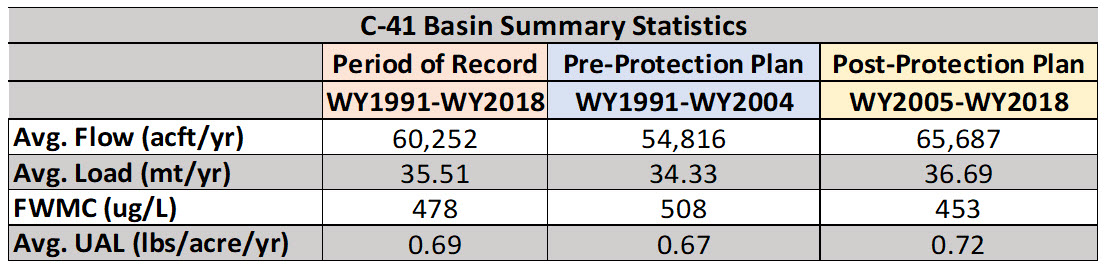
Flow Issues: No
- The proportion of load and flows generated among C-40, C-41, C-41A is not known. It is currently estimated by an algebraic equation.
- The flow increased between pre and post-protection plan periods but it was not statistically significant and there were no statistically significant trends in any period.
- Flow and load estimates were based on major structure values to the lake which did not include irrigation.
Water Quality Issues: Yes
- The TP flow-weighted mean concentrations (FWMC) were among the highest of all basins (453 μg/L during the post-protection plan period) relative to other areas in this subwatershed.
- This basin had the largest contribution of TP load to the subwatershed during both the pre and post-protection plan periods.
- There was a slight decrease (not statistically significant) in the TP flow-weighted mean concentrations (FWMC) between the pre and post-protection plan periods.
>>Additional Technical Information
PROJECTS LOCATED IN THIS BASIN
Purpose: To provide shallow storage, retention and detention to enhance Lake Okeechobee and estuary health by reducing discharge volumes, reducing nutrient loading to downstream receiving waters, and expanding groundwater recharge opportunities.
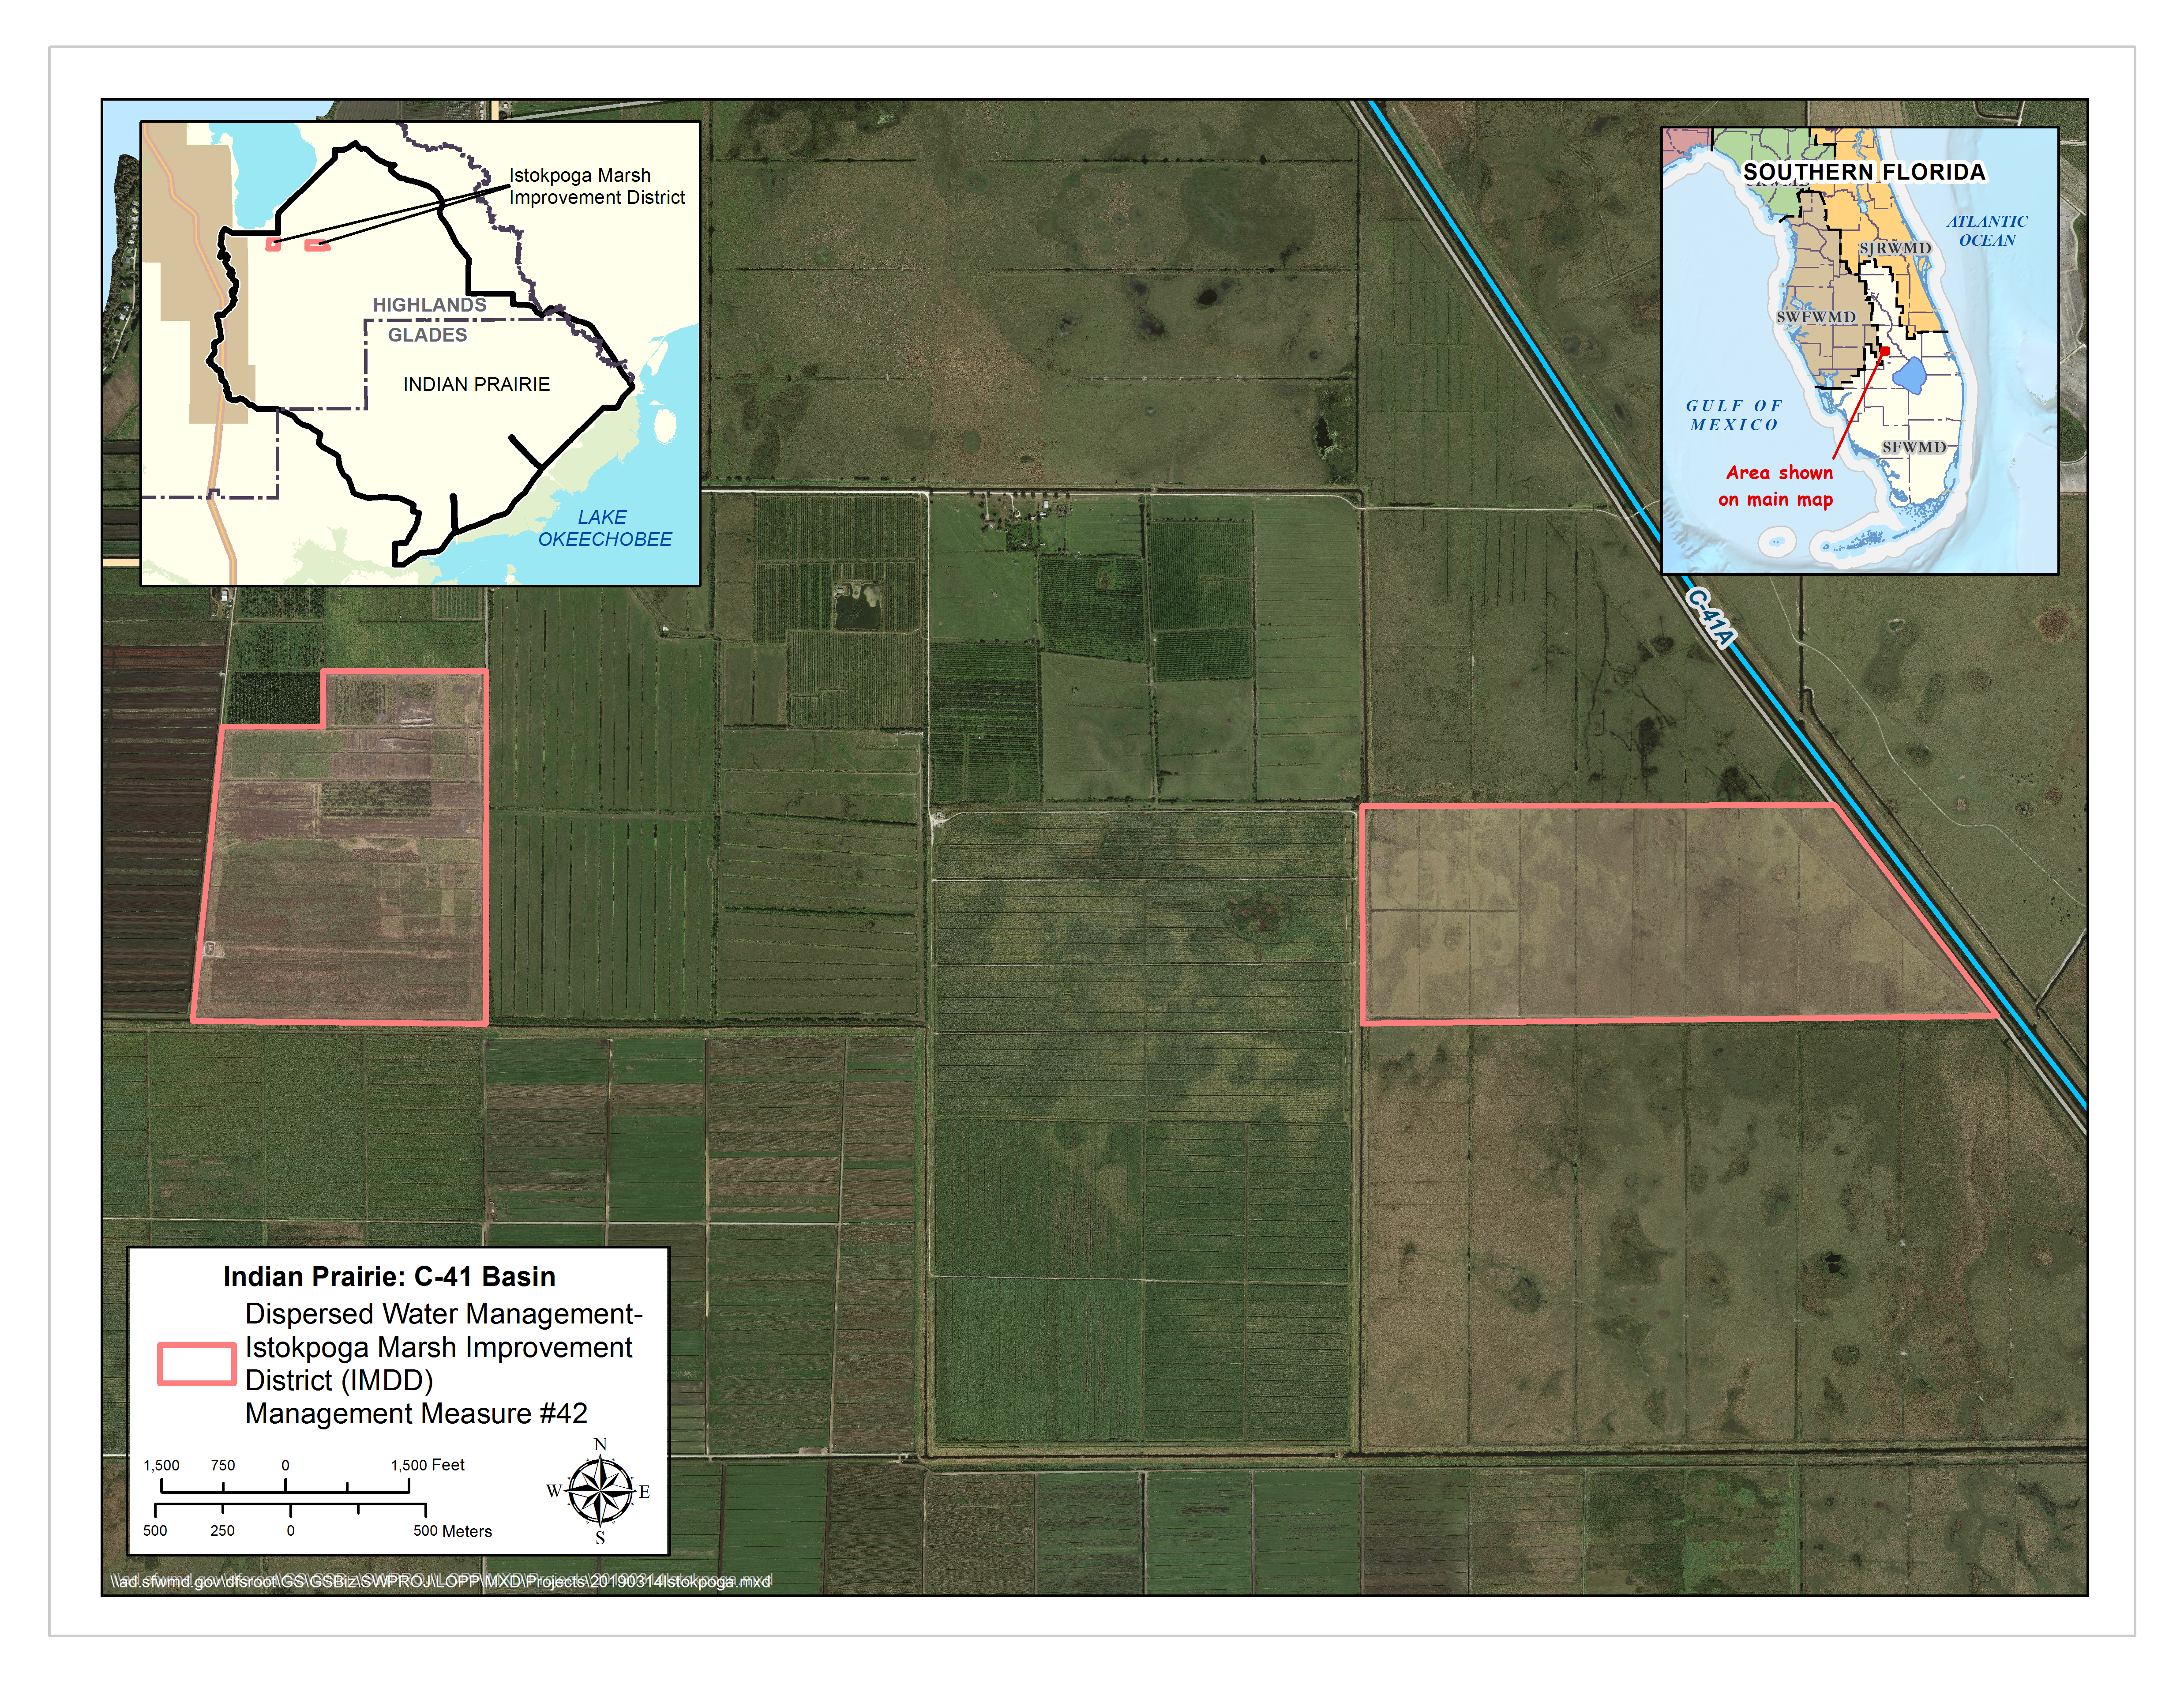 Purpose: Reduce stormwater flows and total phosphorus load entering Lake Okeechobee coming off of the IMWID secondary conveyance system by storing water in above ground impoundments (AGI). Water collected in the impoundments would be made available to IMWID for normal water supply.
C41A BASIN
Total Area: 57,748ac
% Area of Subwatershed: 21%
% TP Load of Lake Okeechobee Watershed: 20%
Monitoring Locations: S84, S84X
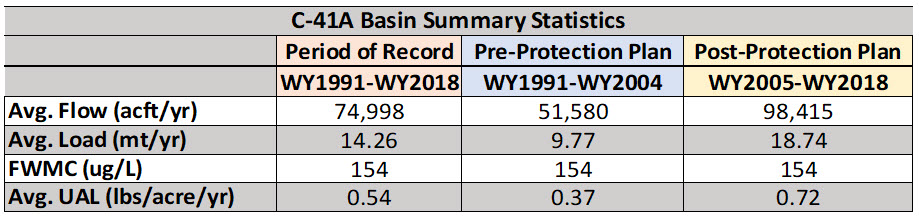
Flow Issues: Yes
- The proportion of load and flows generated among C-40, C-41, C-41A is not known. It is currently estimated by an algebraic equation.
- The flow almost doubled between the pre and post-protection plan periods but there was not a statistically significant difference.
- The unit area flow (UAF) almost doubled between the pre and post-protection plan periods (10.72 inches to 20.45 inches, respectively).
- Flow in this basin is complicated and has been heavily influenced by climatology, projects and flow measurement changes. The distribution of water in this basin may not be consistent between the pre and post-protection plan periods.
- Within the last 10 years, more water may be moving through C-41A due to changes in operations. This should be investigated further.
- Flow and load estimates were based on major structure values to the lake which did not include irrigation.
Water Quality Issues: No
- The TP flow-weighted mean concentrations (FWMC) (154 μg/L) has not changed. However, TP load almost doubled between the pre and post-protection plan periods but there was not a statistically significant difference.
- The TP unit area load almost doubled between the pre and post-protection plan periods.

>>Additional Technical Information
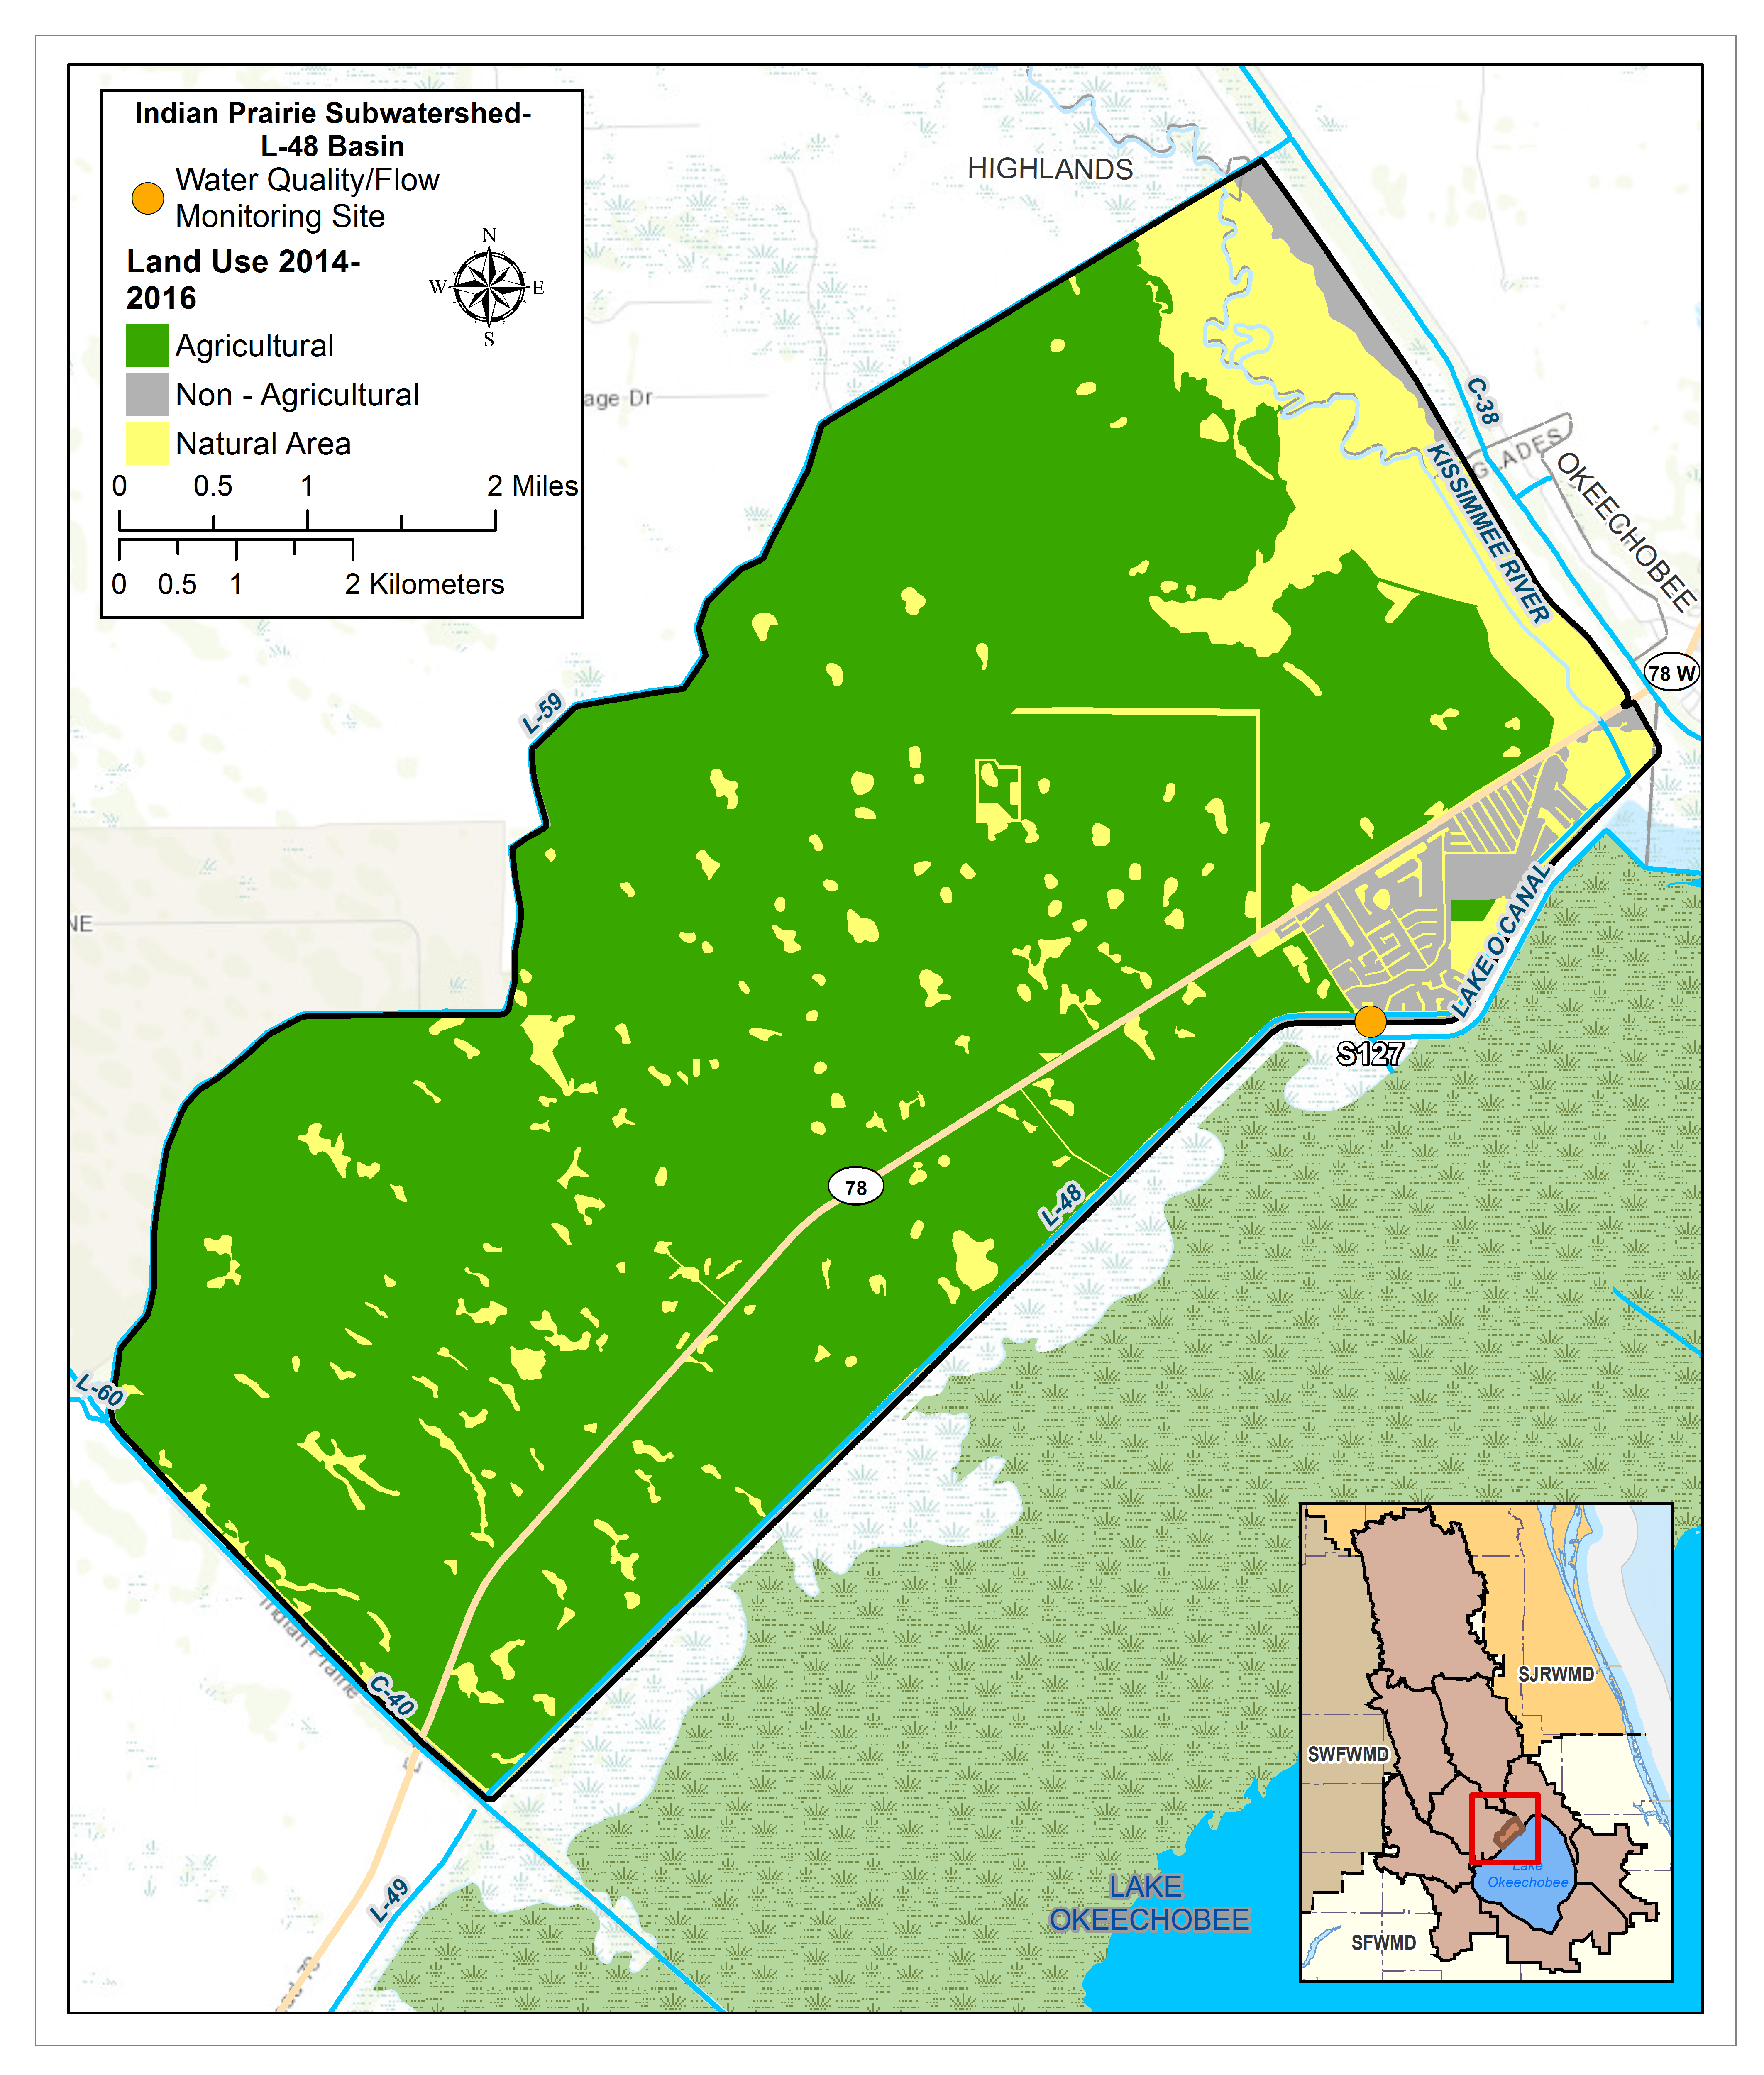
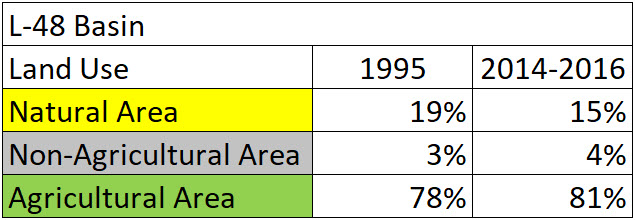
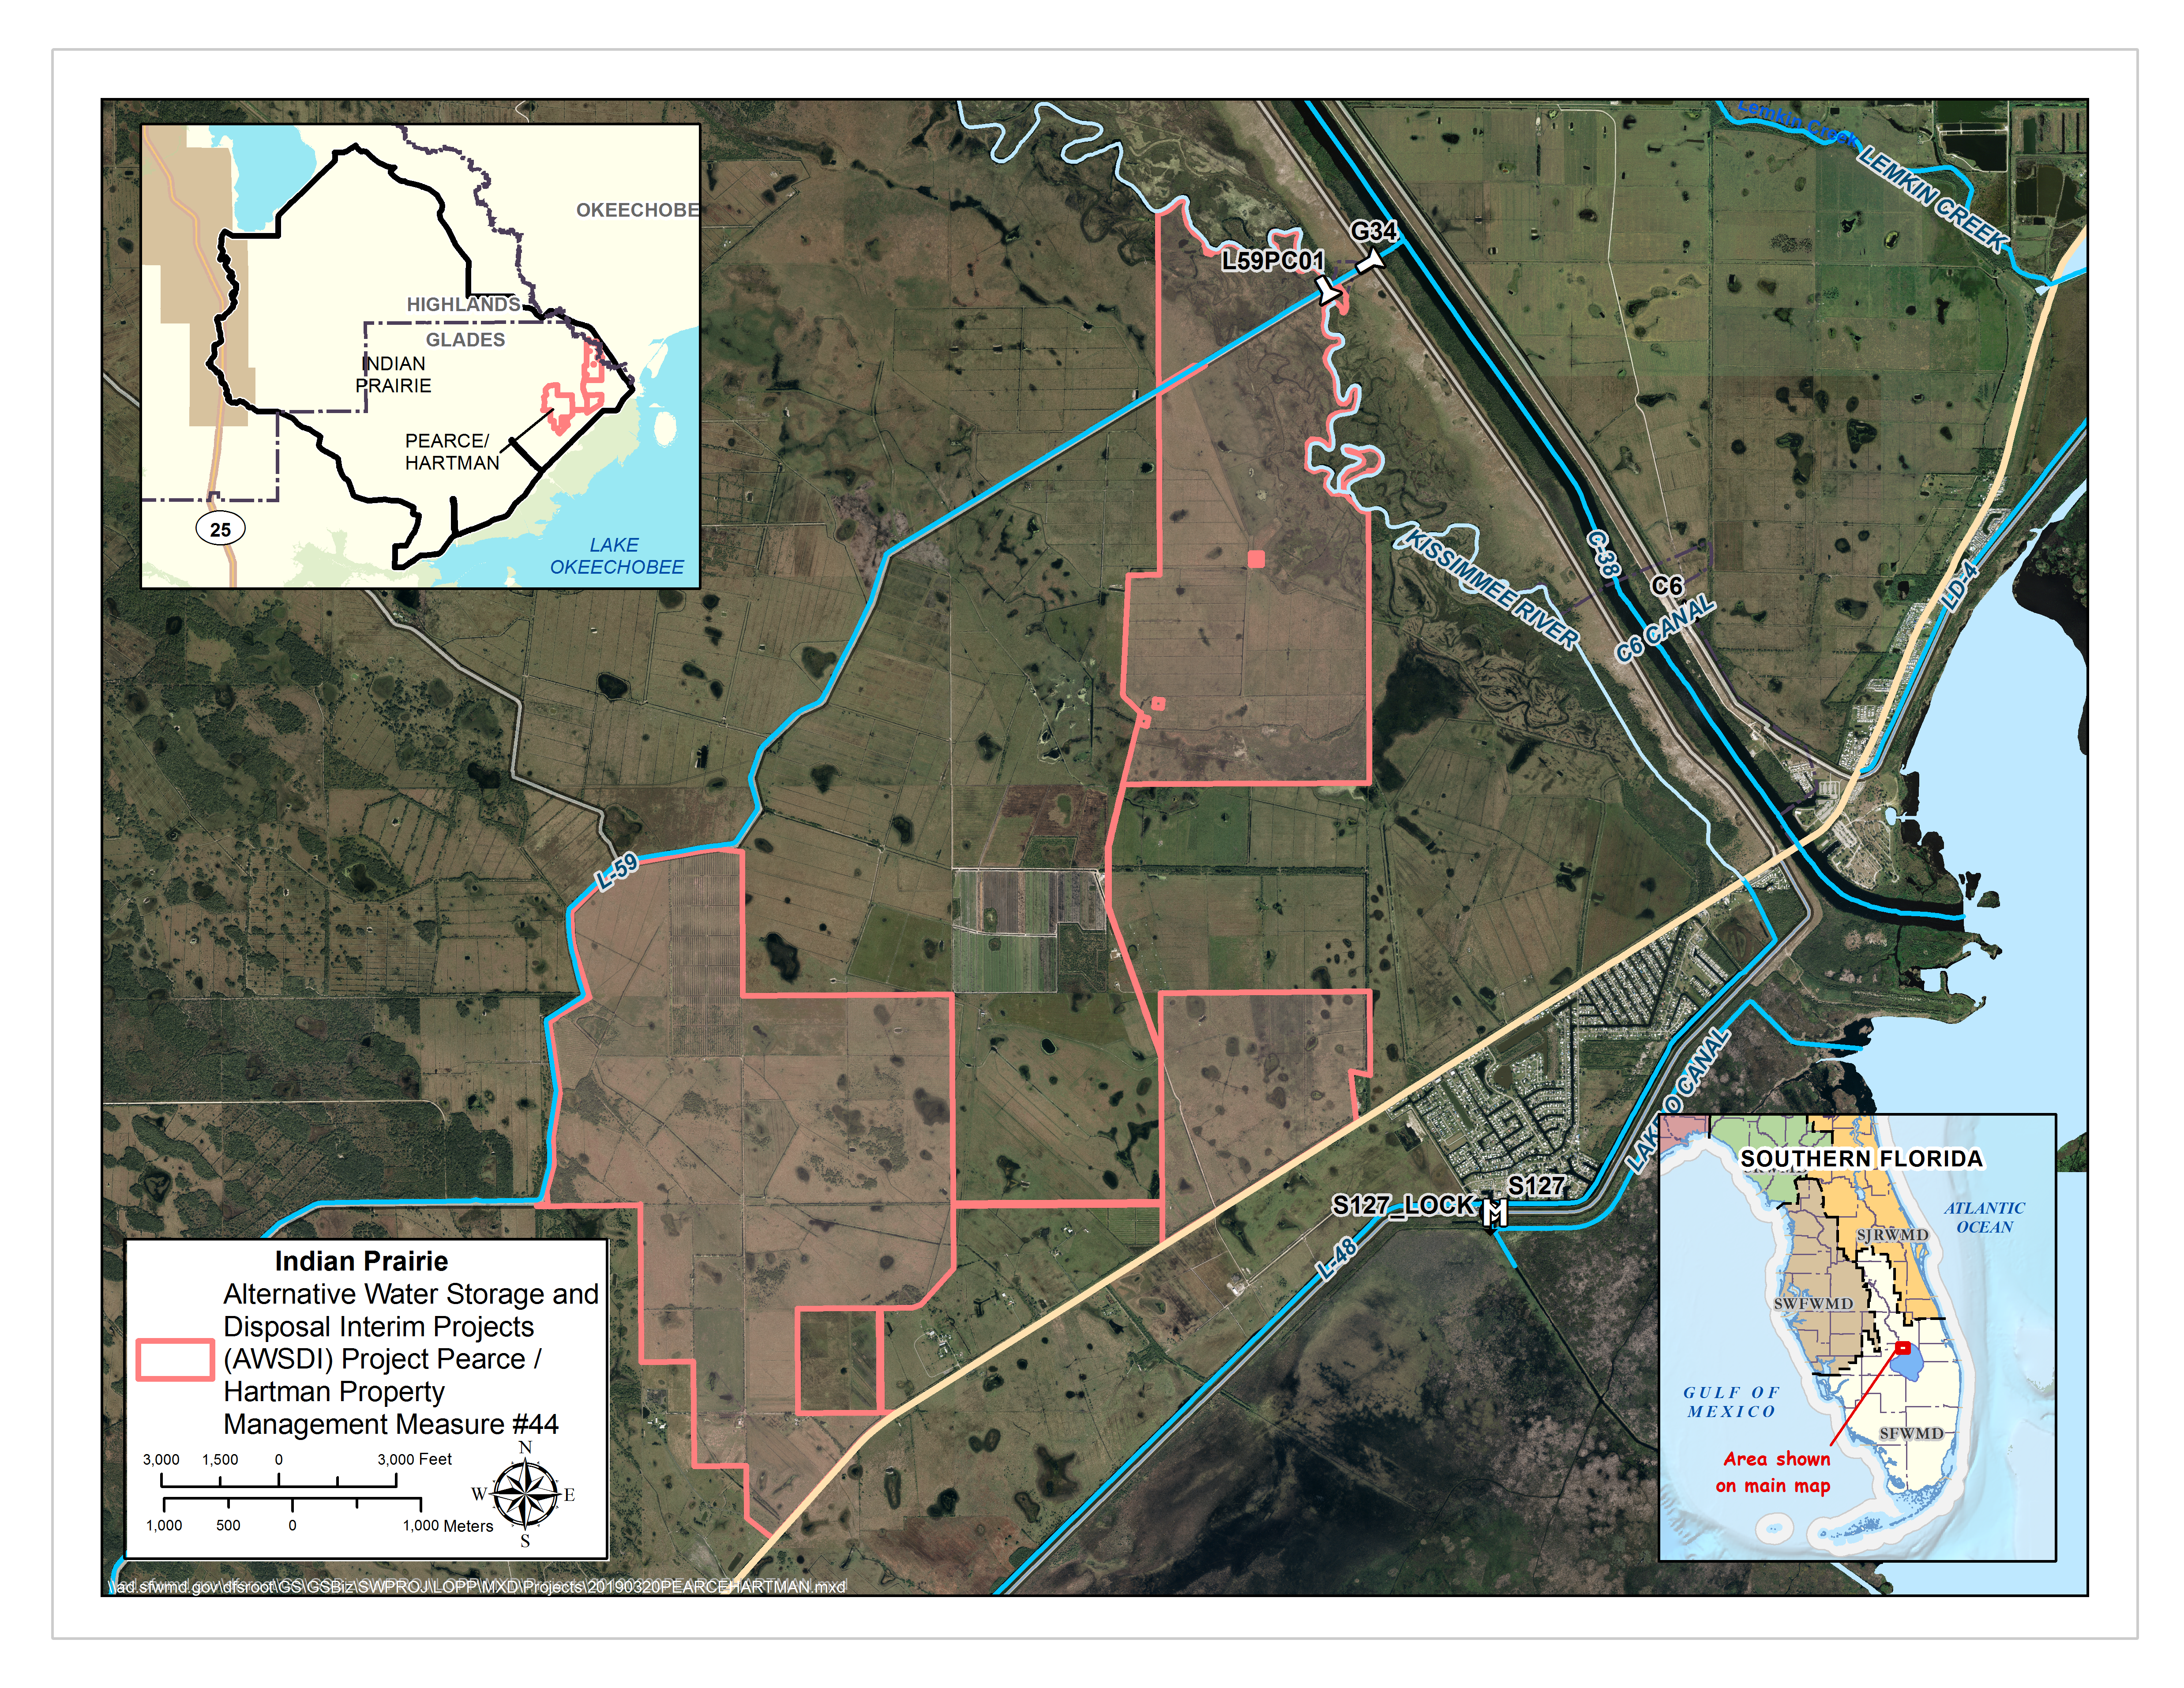
L48 BASIN
Total Area: 20,798ac
% Area of Subwatershed: 8%
% TP Load of Lake Okeechobee Watershed: 5%
Monitoring Locations: S127
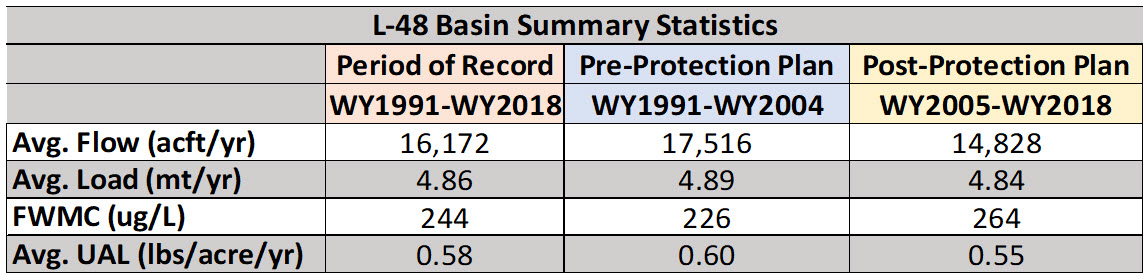
Flow Issues: No
- No statistically significant changes were observed for flows and the contribution of flows were relatively small (5.1% of the subwatershed during the post-protection plan period).
- The Comprehensive Everglades Restoration Project - Lake Okeechobee Watershed Restoration Project Wetland Attenuation Feature is tentatively planned for this basin.
- Flow and load estimates were based on major structure values to the lake which did not include irrigation.
Water Quality Issues: No
- There is a decreasing trend for total phosphorus (TP) flow-weighted mean concentrations (FWMC) in both pre and post-protection plan periods; however, it was only statistically significant in the pre-protection plan period.
- The TP load did not change much between the two periods (pre = 4.89 mt/yr; post = 4.84 mt/yr) and the TP load contribution to the subwatershed is relatively small (5.1% during the post-protection plan period).
>>Additional Technical Information
PROJECTS LOCATED IN THIS BASIN
 Purpose: Utilize interim facilities for water storage by employing a range of site alternative measures at a number of project sites. Alternatives include construction of on-site measures such as temporary ditch blocks, minor berms, minimal earthwork, wetland restoration, and potential water diversions to the project site using temporary pump facilities.
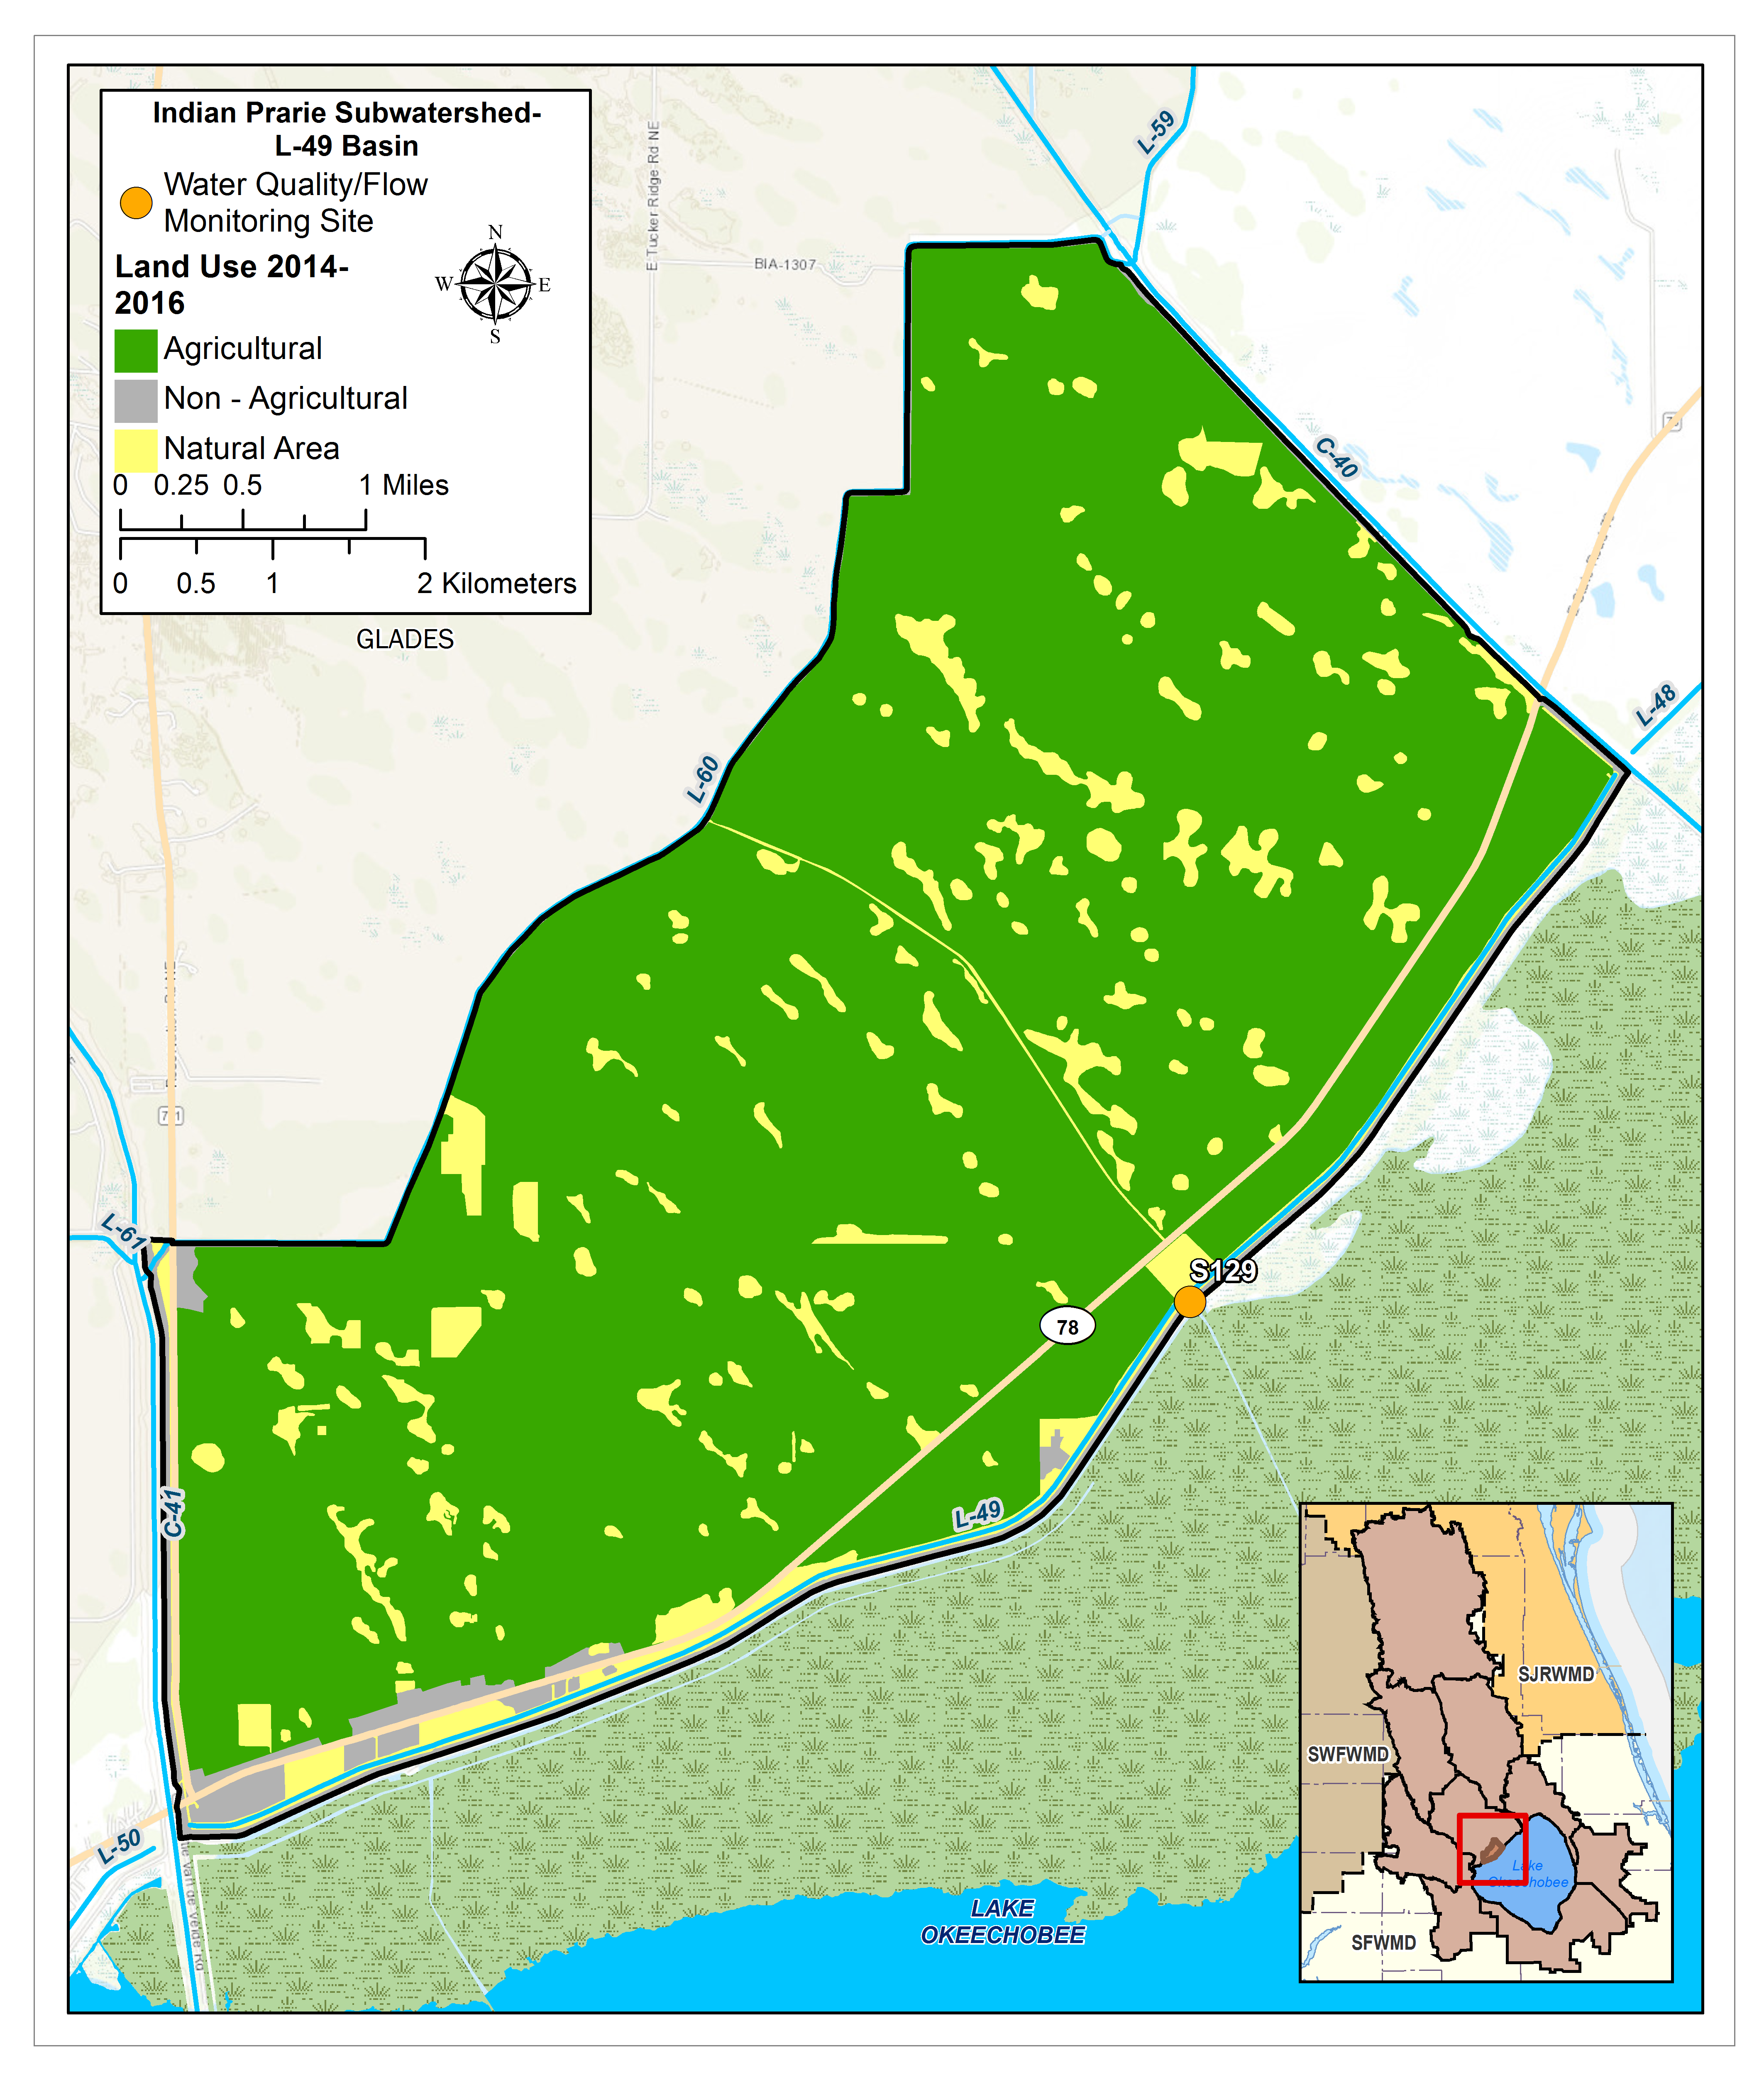
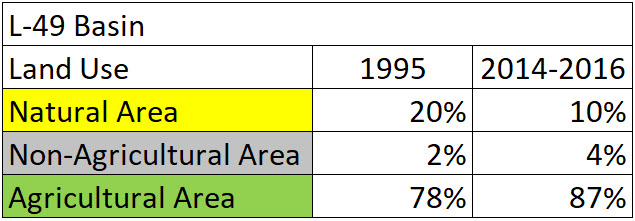
L49 BASIN
Total Area: 11,966ac
% Area of Subwatershed: 4%
% TP Load of Lake Okeechobee Watershed: 0.3%
Monitoring Locations: S-129
Flow Issues: No
- A decrease in flow between pre and post-protection plan periods was noted, although it was not statistically significant.
- The contribution in flows were relatively small (3.8% of the subwatershed flows during the post-protection plan period).
- Flow and load estimates were based on major structure values to the lake which did not include irrigation.
Water Quality Issues: No
- The total phosphorus (TP) flow-weighted mean concentrations (FWMC) decreased between pre and post-protection plan periods, although it was not statistically significant.
- A statistically significant decreasing trend was noted in FWMC in the post-protection plan period.
- A decrease in load between the pre and post-protection plan periods was noted, although it was not statistically significant.
>>Additional Technical Information
PROJECTS LOCATED IN THIS BASIN
 Purpose: Utilize interim facilities for water storage by employing a range of site alternative measures at a number of project sites. Alternatives include construction of on-site measures such as temporary ditch blocks, minor berms, minimal earthwork, wetland restoration, and potential water diversions to the project site using temporary pump facilities.
L59E BASIN
Total Area: 12,589ac
% Area of Subwatershed: 5%
% TP Load of Lake Okeechobee Watershed: 0.4%
Monitoring Locations: G33, G34, C38W/L59E
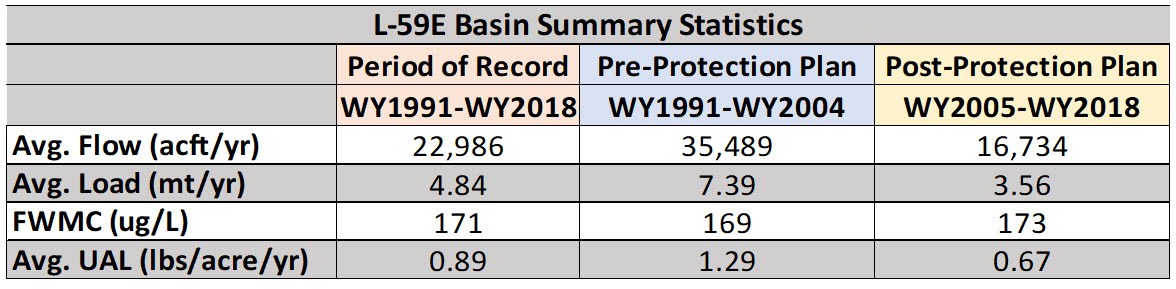
Flow Issues: Maybe
- Prior to WY1995 flows were estimated and no flow measurements were collected between WY1995 and WY2001. Then flows were measured beginning in WY2002.
- May need to review flows between pre-and post-protection plan periods to see if changes in flow measurement methods occurred affected results’ comparability.
- Flow and load estimates were based on major structure values to the lake which did not include irrigation.
Water Quality Issues: Maybe
- There were no statistically significant trends in total phosphorus (TP) flow-weighted mean concentrations (FWMC).

>>Additional Technical Information
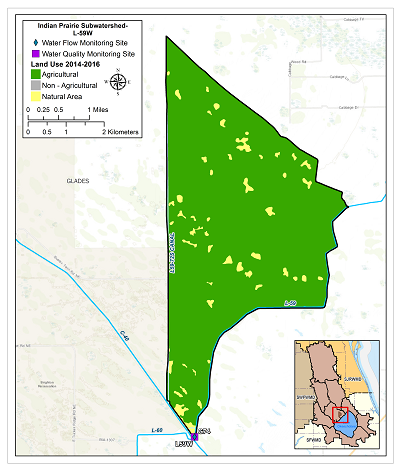
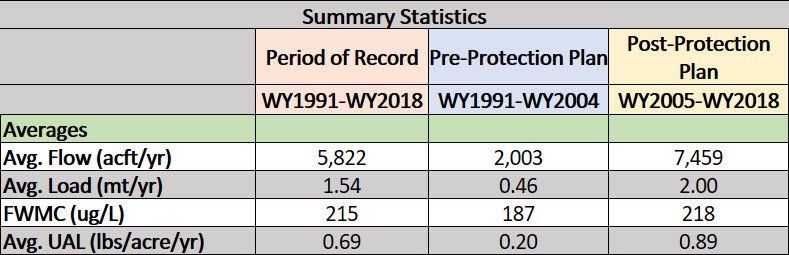
L59W BASIN
Total Area: 6,596ac
% Area of Subwatershed: 2%
% TP Load of Lake Okeechobee Watershed: 0.2%
Monitoring Locations: G74, L59W
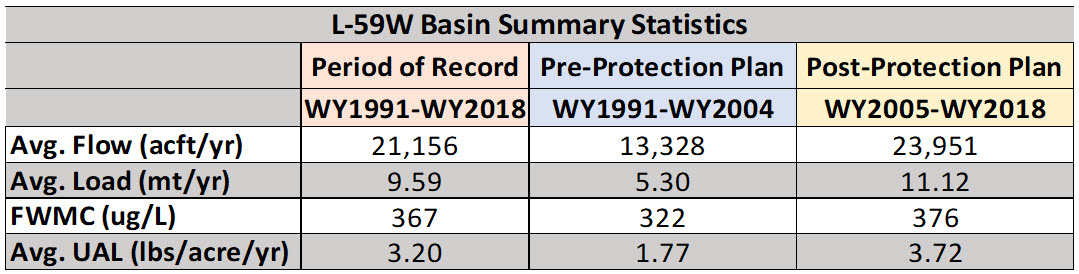
Flow Issues: Maybe
- Prior to WY1995 flows were estimated and no flow measurements were collected between WY1995 and WY2003; therefore, comparisons cannot be made between the pre and post-protection plan periods.
- There appeared to be increases in flow between pre and post-protection plans periods but unable to determine if this increase is due to the missing or estimated flow measurements in the pre-protection plan period or another factor.
- Flow and load estimates were based on major structure values to the lake which did not include irrigation.
Water Quality Issues: Maybe
- The total phosphorus (TP) flow-weighted mean concentrations (FWMC) for the post-protection plan period were 302 μg/L.

>>Additional Technical Information
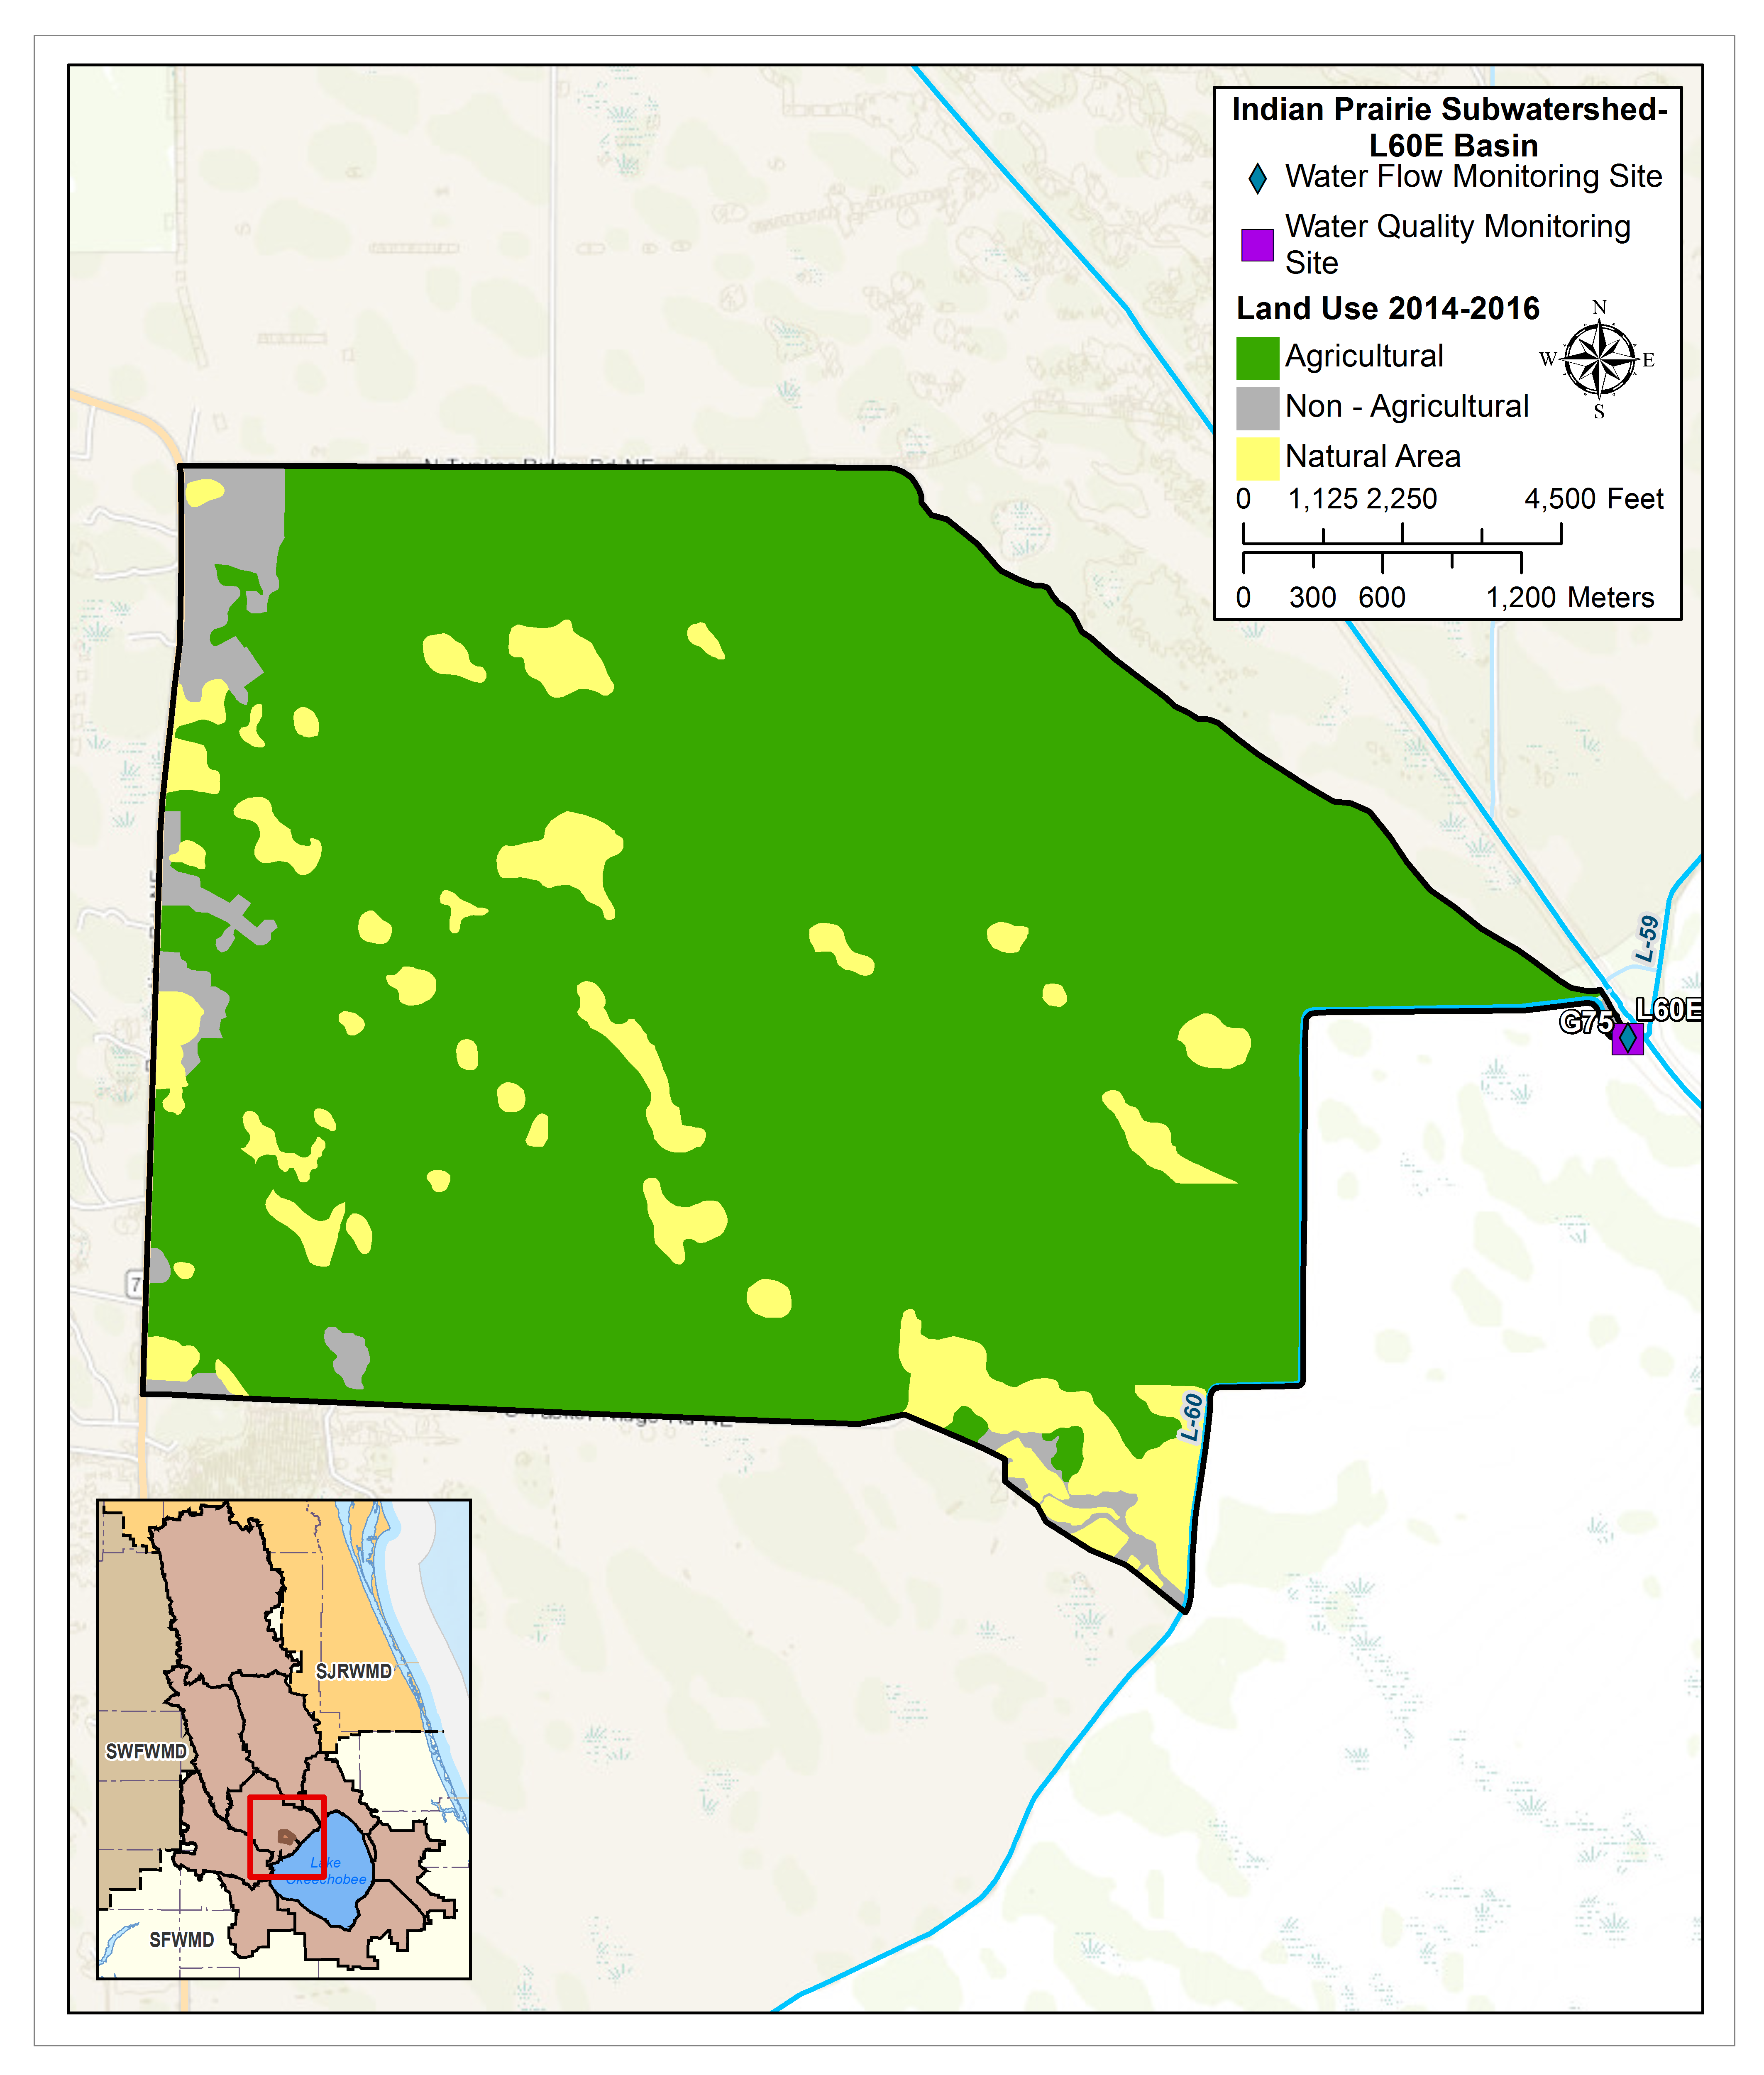
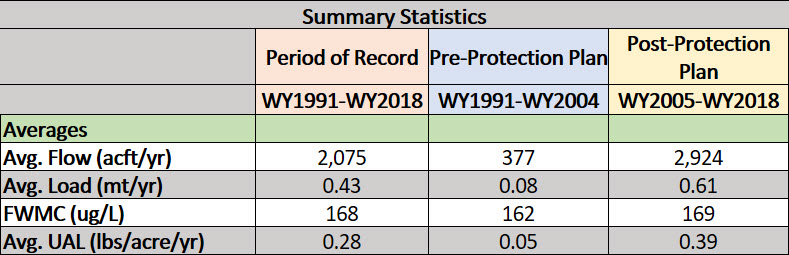
L60E BASIN
Total Area: 4,944ac
% Area of Subwatershed: 2%
% TP Load of Lake Okeechobee Watershed: 0.1%
Monitoring Locations: G75, L60E
Flow Issues: Maybe
- Prior to WY1995 flows were estimated and no flow measurements were collected between WY1995 and WY2002; therefore, comparisons cannot be made between the pre and post-protection plan periods.
- There appeared to be an increase in flow between pre and post-protection plans periods but unable to determine if this increase is due to the missing or estimated flow measurements in the pre-protection period or another factor.
- Flow and load estimates were based on major structure values to the lake which did not include irrigation.
Water Quality Issues: Maybe
- Increases in total phosphorus (TP) flow-weighted mean concentrations (FWMC) and loads were observed between pre and post-protection plans periods but unable to determine if this increase is due to the missing or estimated flow measurements in the pre-protection period or another factor.

>>Additional Technical Information
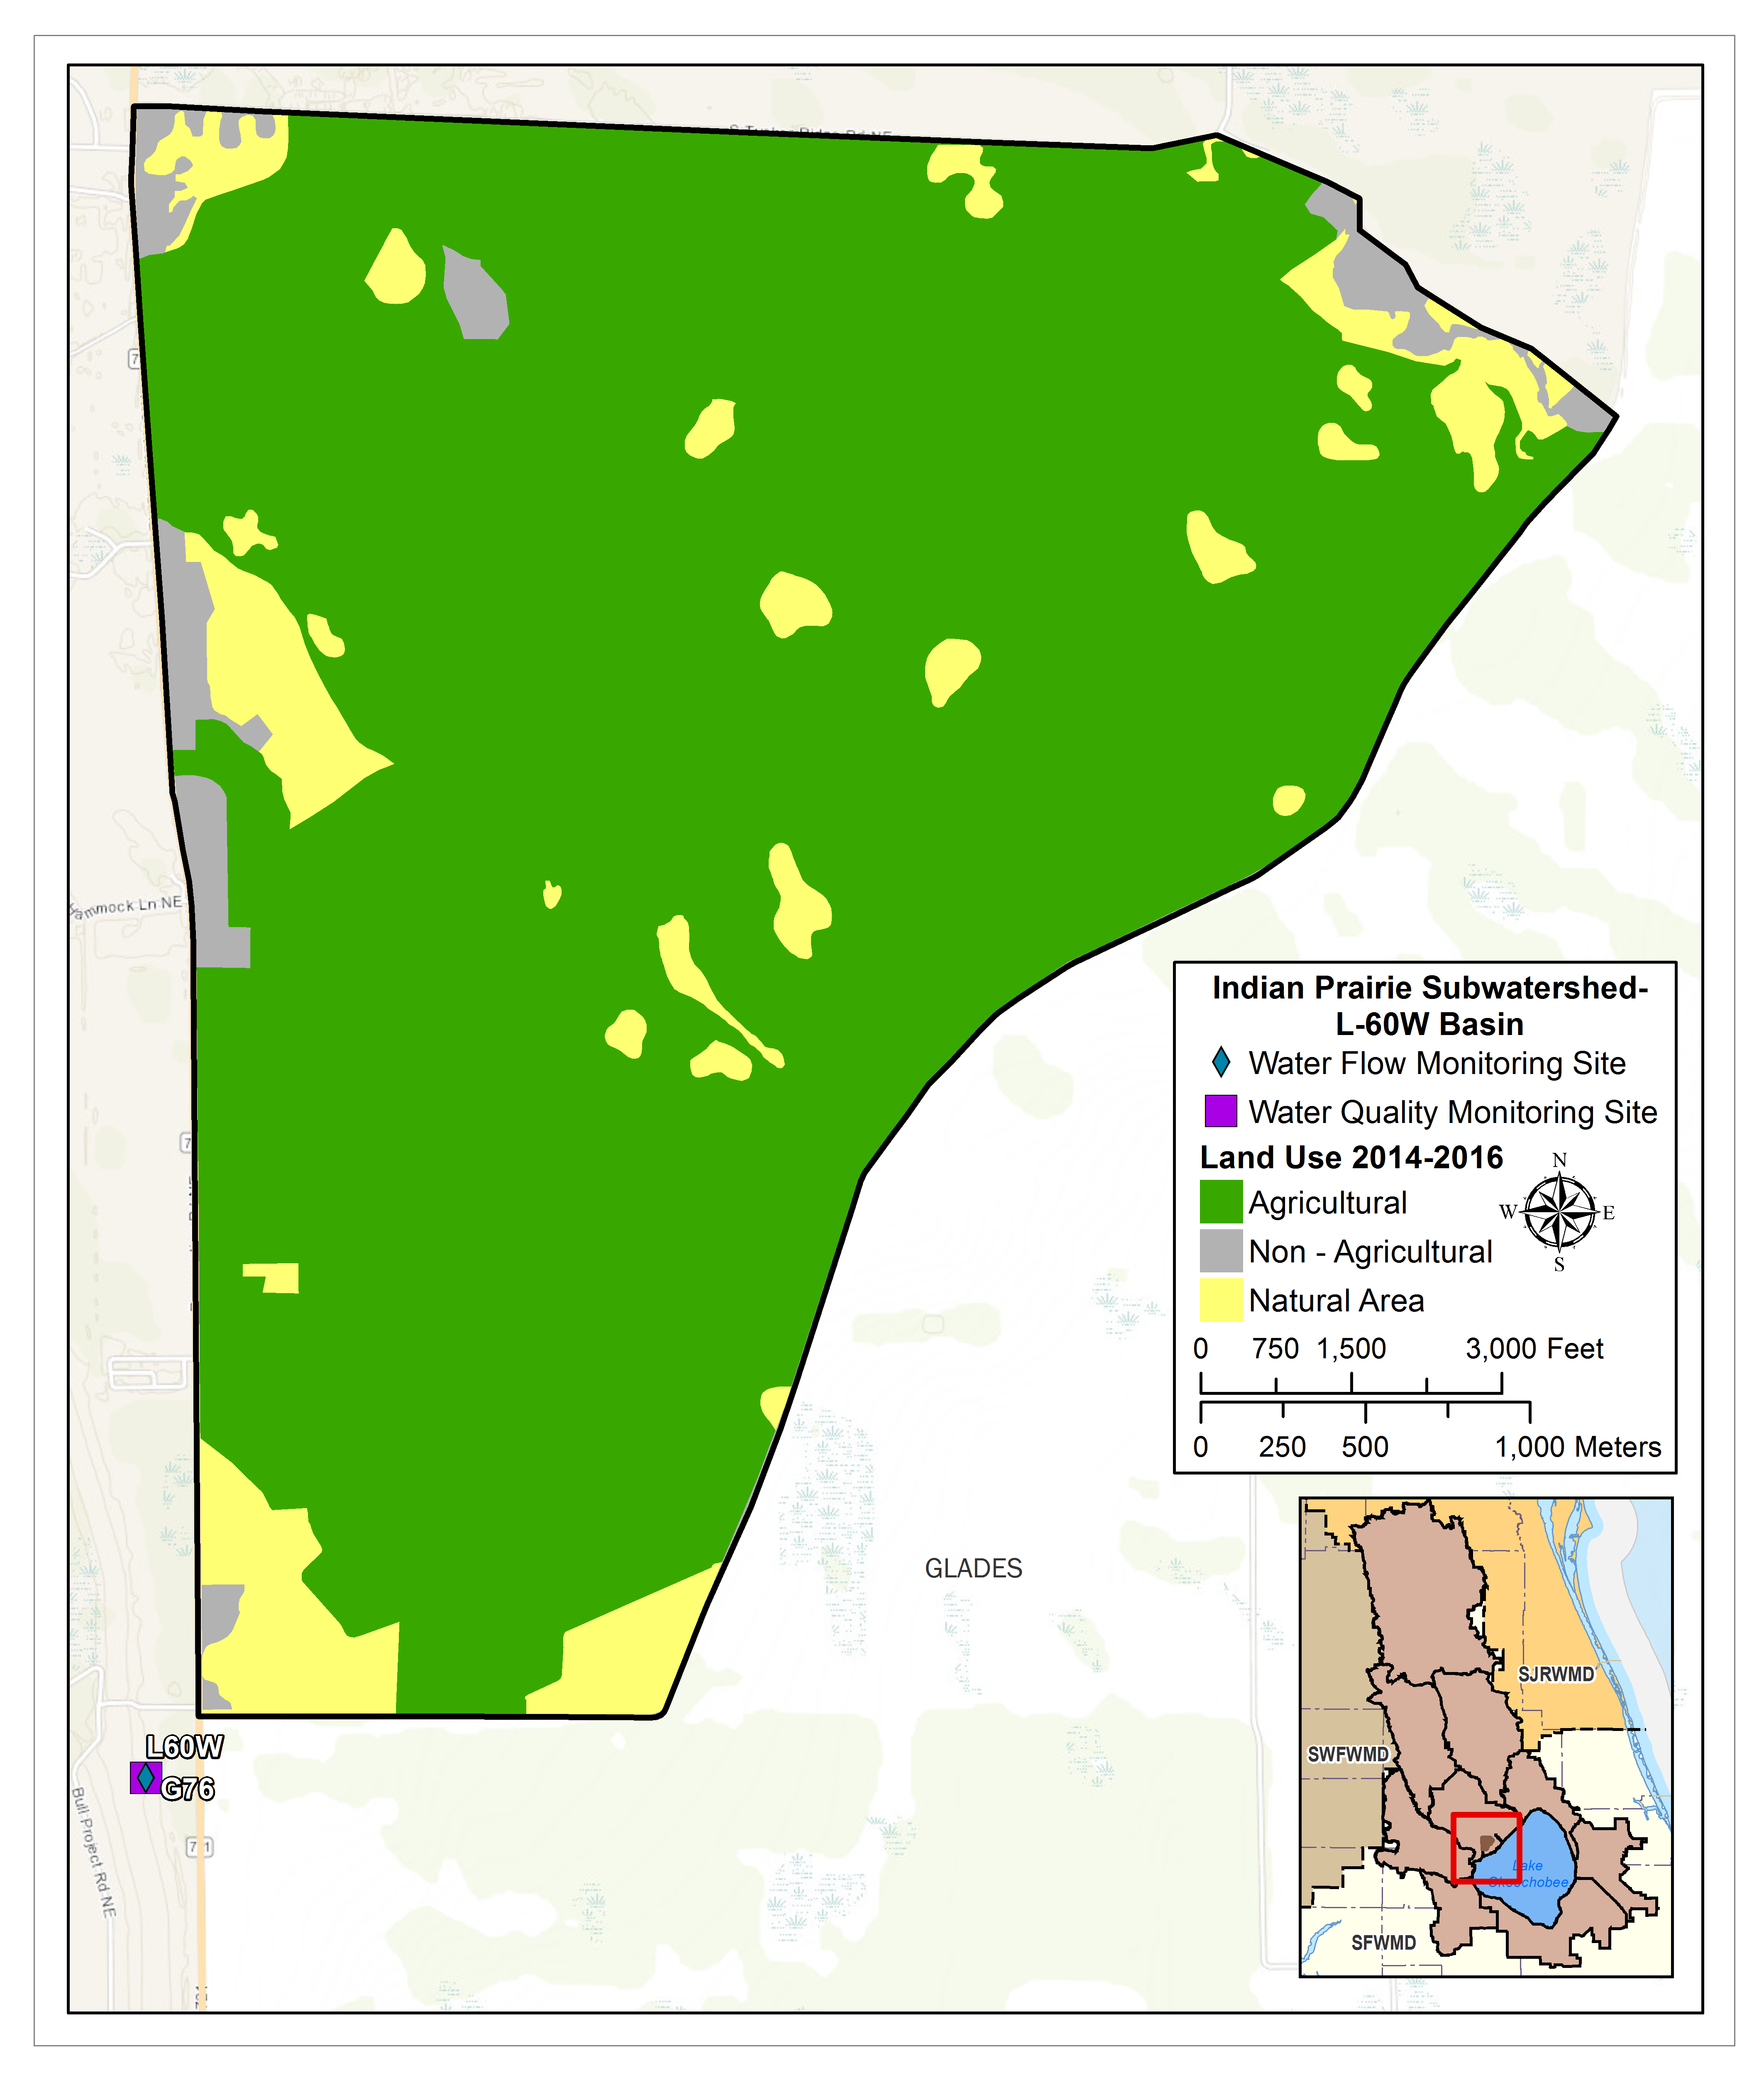
L60W BASIN
Total Area: 3,453ac
% Area of Subwatershed: 1%
% TP Load of Lake Okeechobee Watershed: 0.1%
Monitoring Locations: G76, L60W
Flow Issues: Maybe
- Prior to WY1995 flows were estimated and no flow measurements were collected between WY1995 and WY2001; therefore, comparisons cannot be made between the pre and post-protection plan periods.
- This basin contributed 1% of the flows to the subwatershed in the post-protection plan period.
- There was a statistically significant increasing trend in flow during the post-protection plan period. Continued monitoring is recommended.
- Flow and load estimates were based on major structure values to the lake which did not include irrigation.
Water Quality Issues: Maybe
- There appeared to be increases in total phosphorus (TP) flow-weighted mean concentrations (FWMC) and loads between pre and post-protection plans periods but unable to determine if this increase is due to the missing or estimated flow measurements in the pre-protection period or another factor.
- This basin had relatively low TP FWMC (169 μg/L during the post-protection plan period).

>>Additional Technical Information
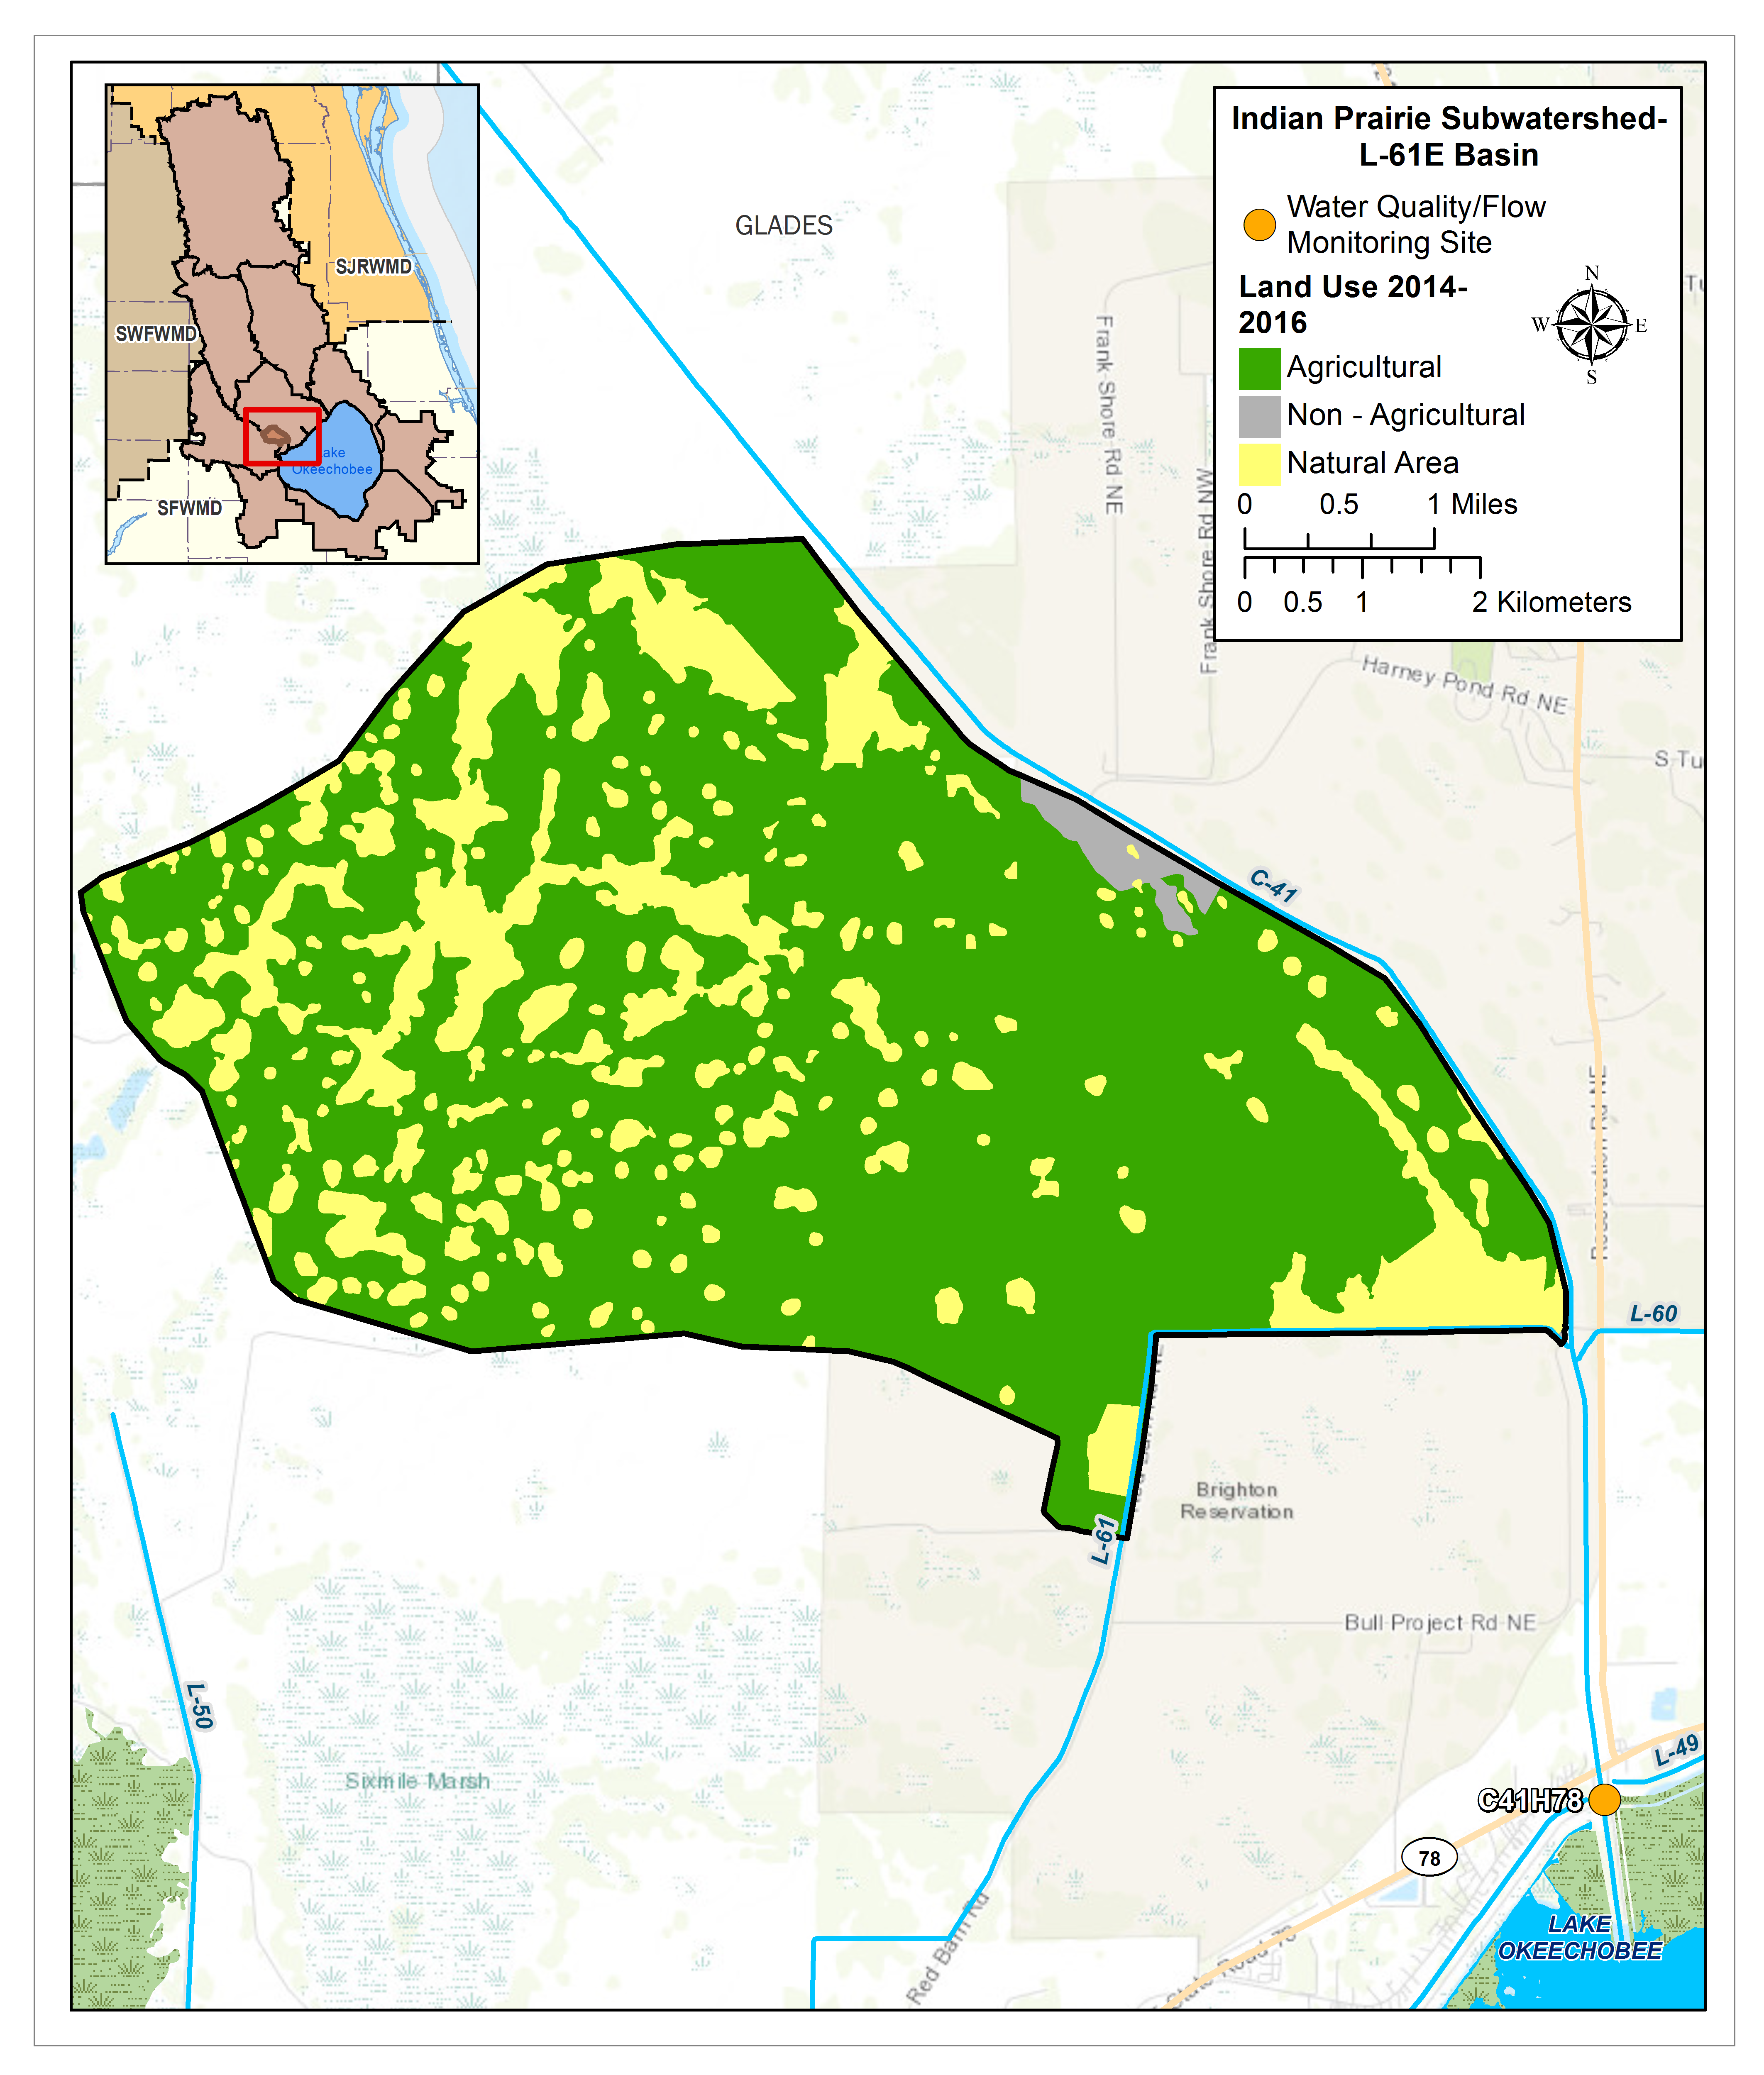
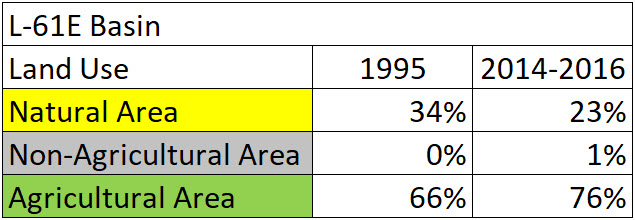
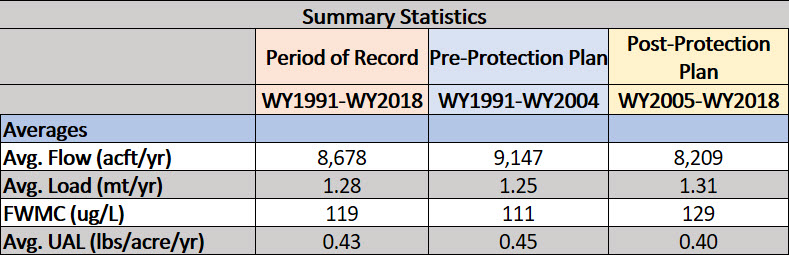
L61E BASIN
Total Area: 14,407ac
% Area of Subwatershed: 5%
% TP Load of Lake Okeechobee Watershed: 0.4%
Monitoring Locations: C41H78

Flow Issues: Maybe
- The flow measurement data for this basin may not be reliable. Prior to WY1995 flows were estimated and no flow measurements were collected between WY1995 and WY2007.
- There appeared to be an increase in flows between pre and post-protection plans periods but unable to determine if this increase is due to the missing or estimated flow measurements in the pre-protection period or another factor.
- No statistically significant trends in flows were observed in the post-protection plan period.
- Flow and load estimates were based on major structure values to the lake which did not include irrigation.
Water Quality Issues: Maybe
- There appeared to be an increase in total phosphorus (TP) loads between pre and post-protection plans periods but unable to determine if this increase is due to the missing or estimated flow measurements in the pre-protection period or another factor.
- A decrease in TP flow-weighted mean concentrations (FWMC) between pre and post-protection plan periods was noted but it was not statistically significant.
- There were no statistically significant trends in TP loads or FWMC in the post-protection plan period.
>>Additional Technical Information
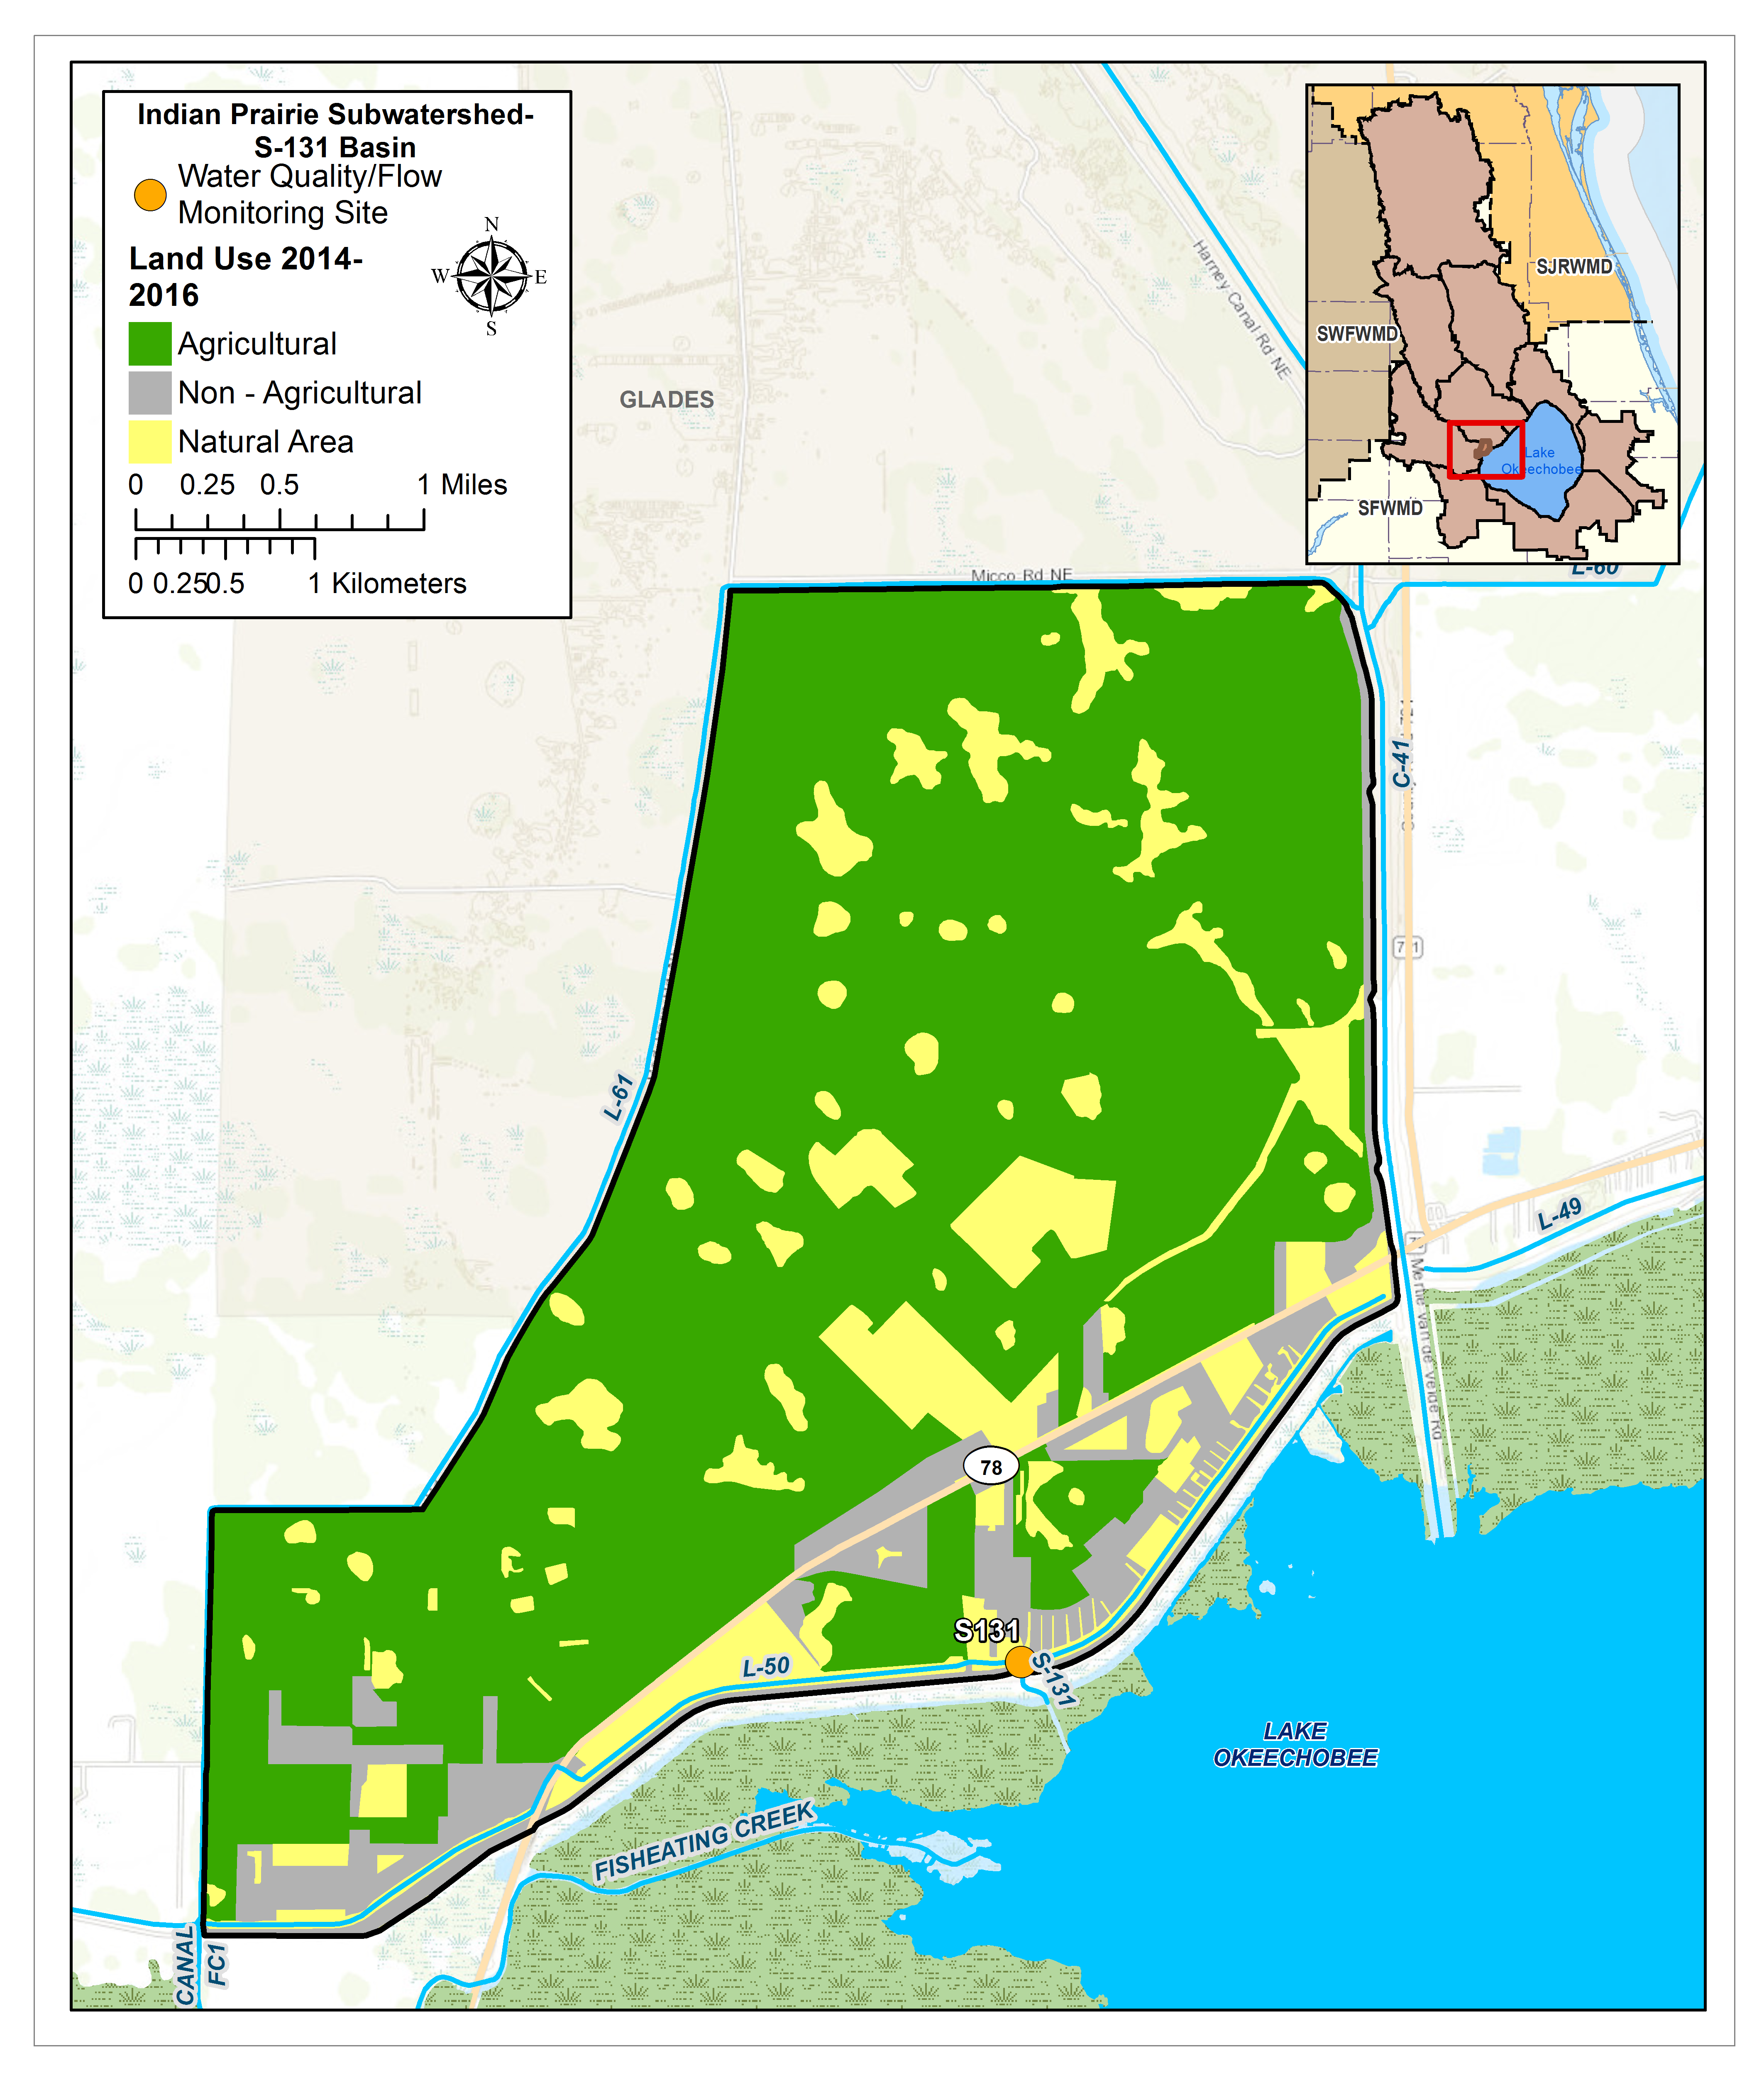
S131 BASIN
Total Area: 7,122ac
% Area of Subwatershed: 3%
% TP Load of Lake Okeechobee Watershed: 0.2%
Monitoring Locations: S131
Flow Issues: No
- There was a decrease in flow between pre and post-protection plan periods, but it was not statistically significant.
- No statistically significant trends in flow.
- Flow and load estimates were based on major structure values to the lake which did not include irrigation.
Water Quality Issues: No
- Although there was a slight increase in total phosphorus (TP) flow-weighted mean concentrations (FWMC), between the pre and post-protection plan periods, the TP concentration is relatively low (129 μg/L) and this basin has a small contribution to the subwatershed (1.4% of the TP loads during the post-protection plan period).
- There were no statistically significant trends in TP FWMC or loads.
>>Additional Technical Information
FISHEATING CREEK BASINS
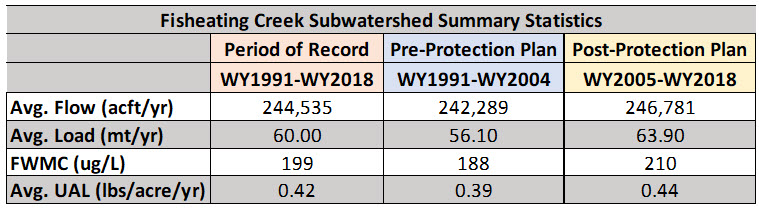
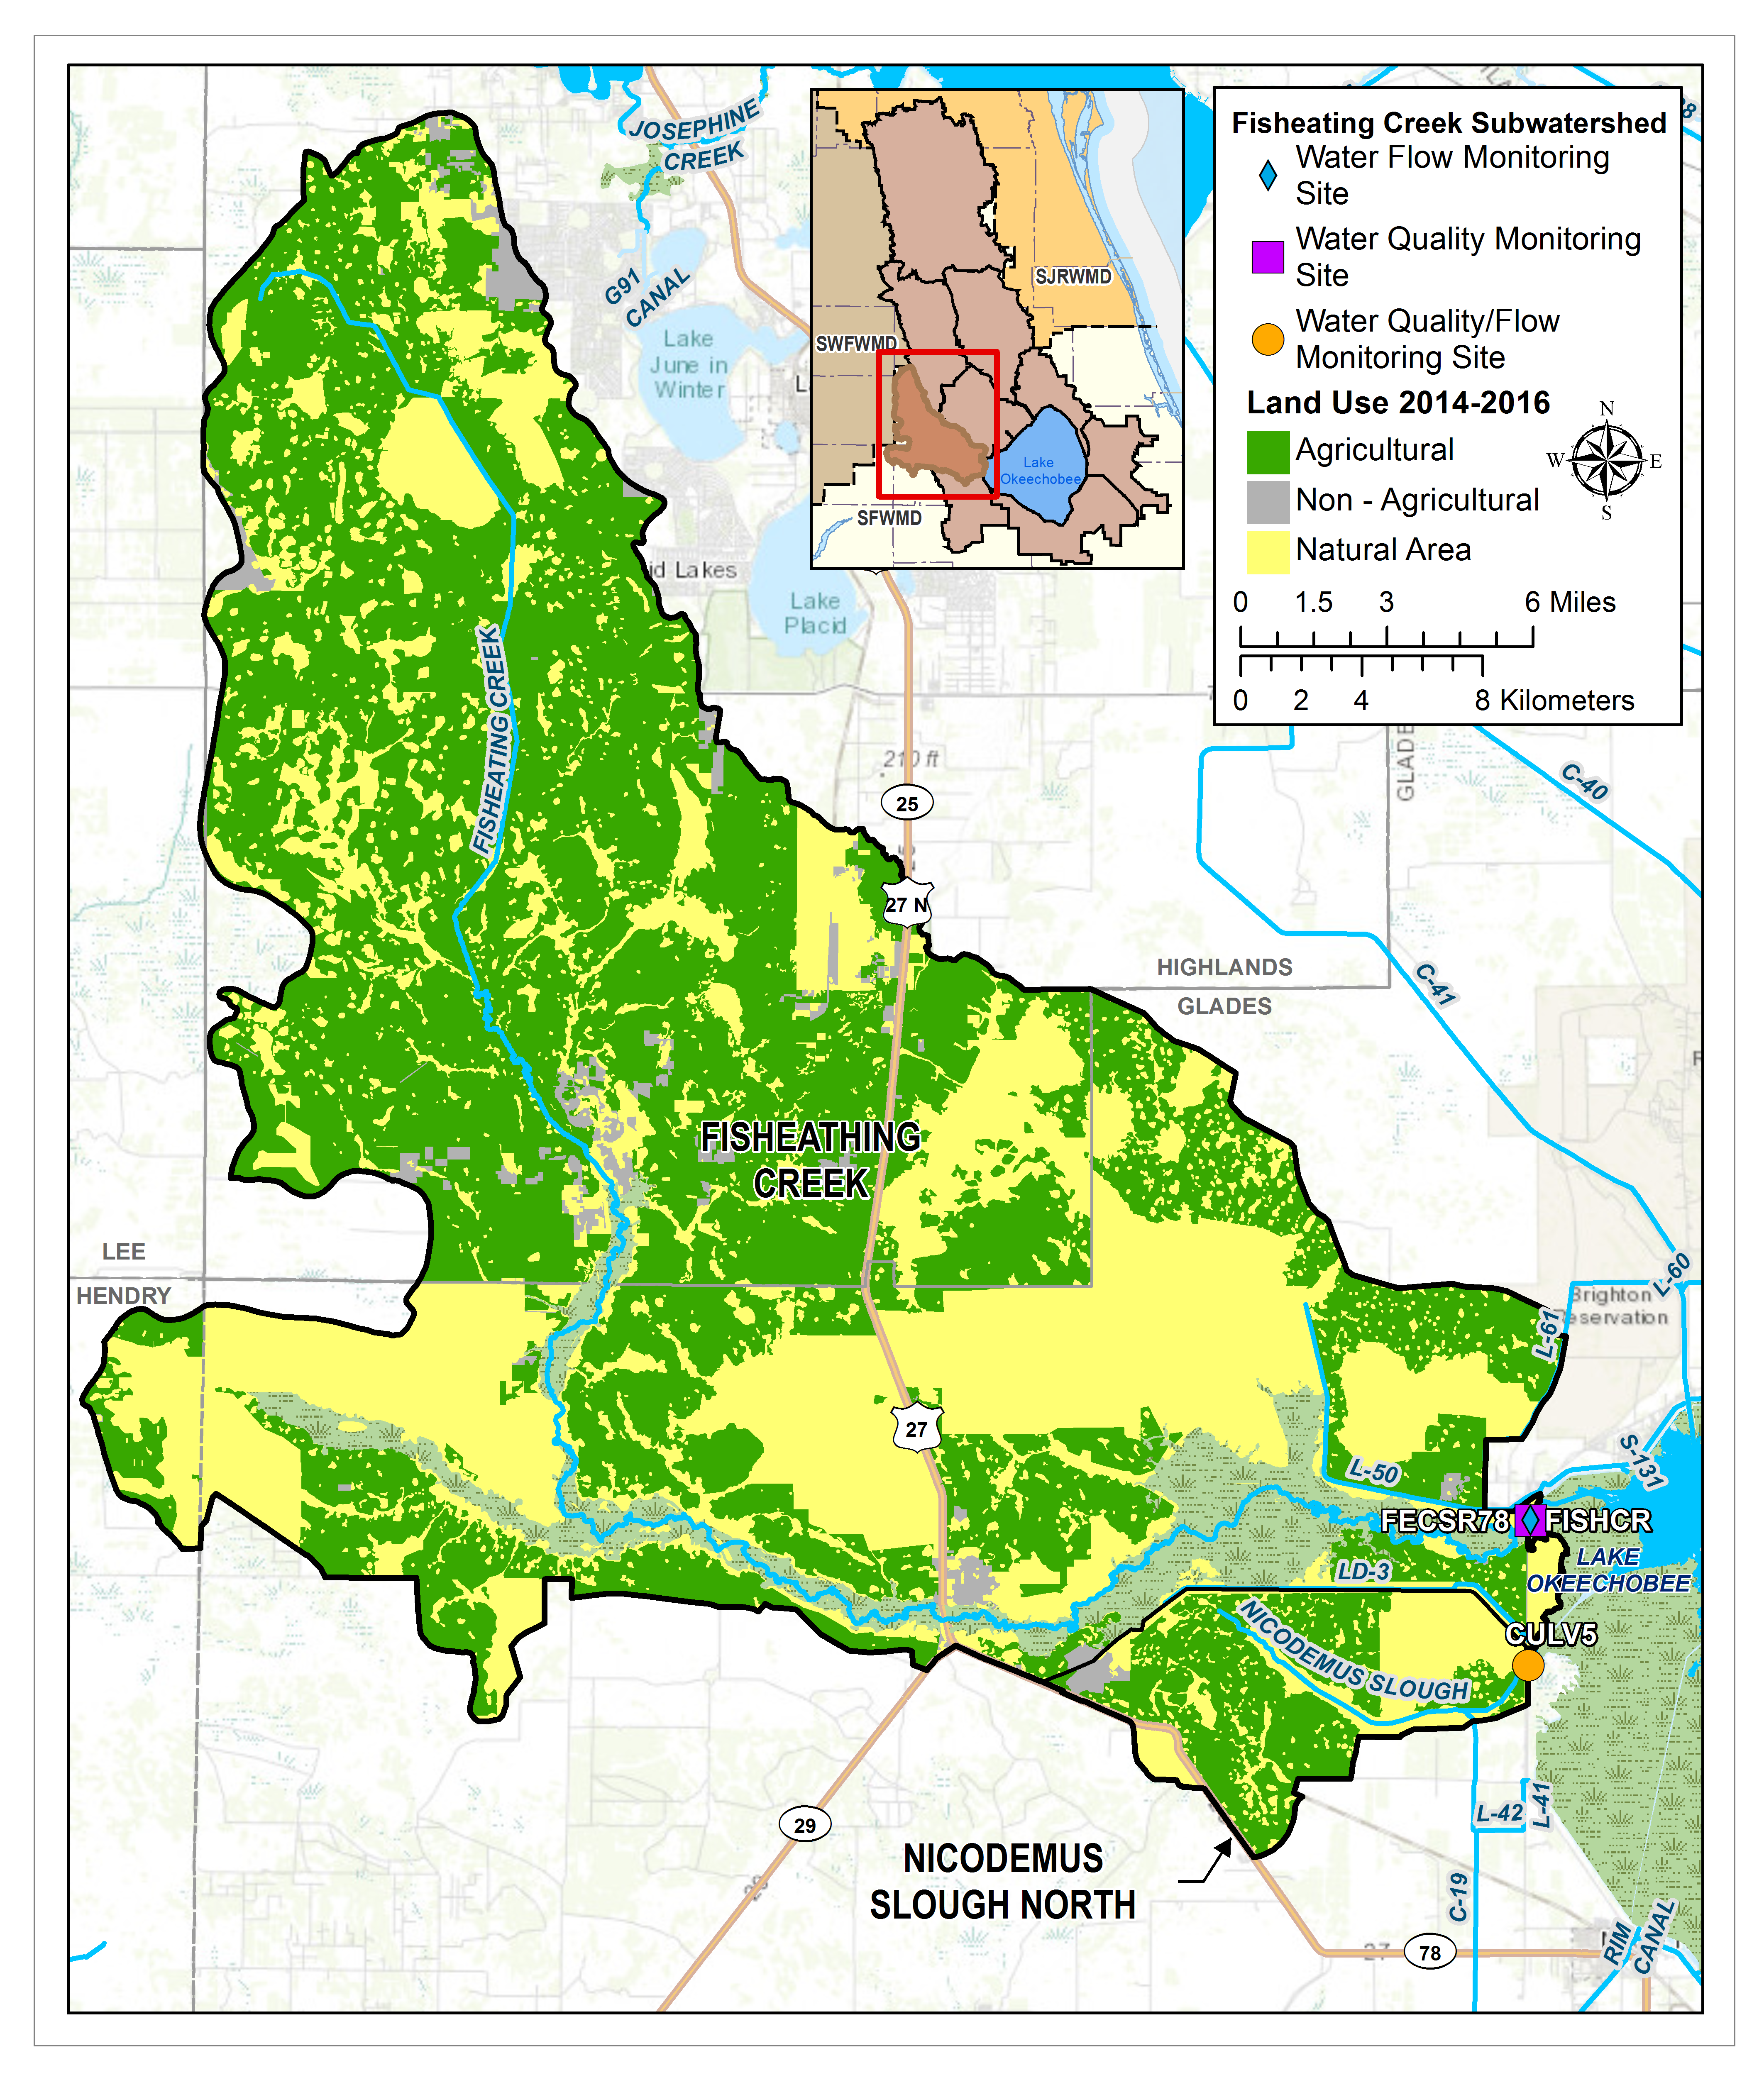
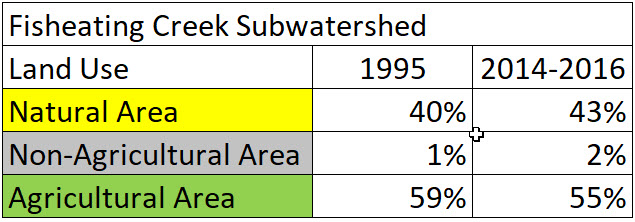
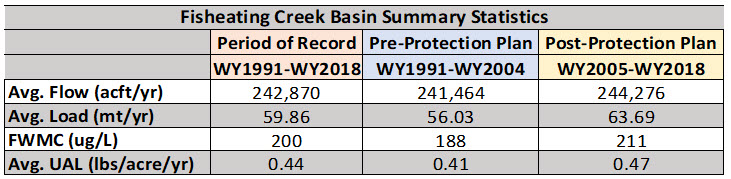
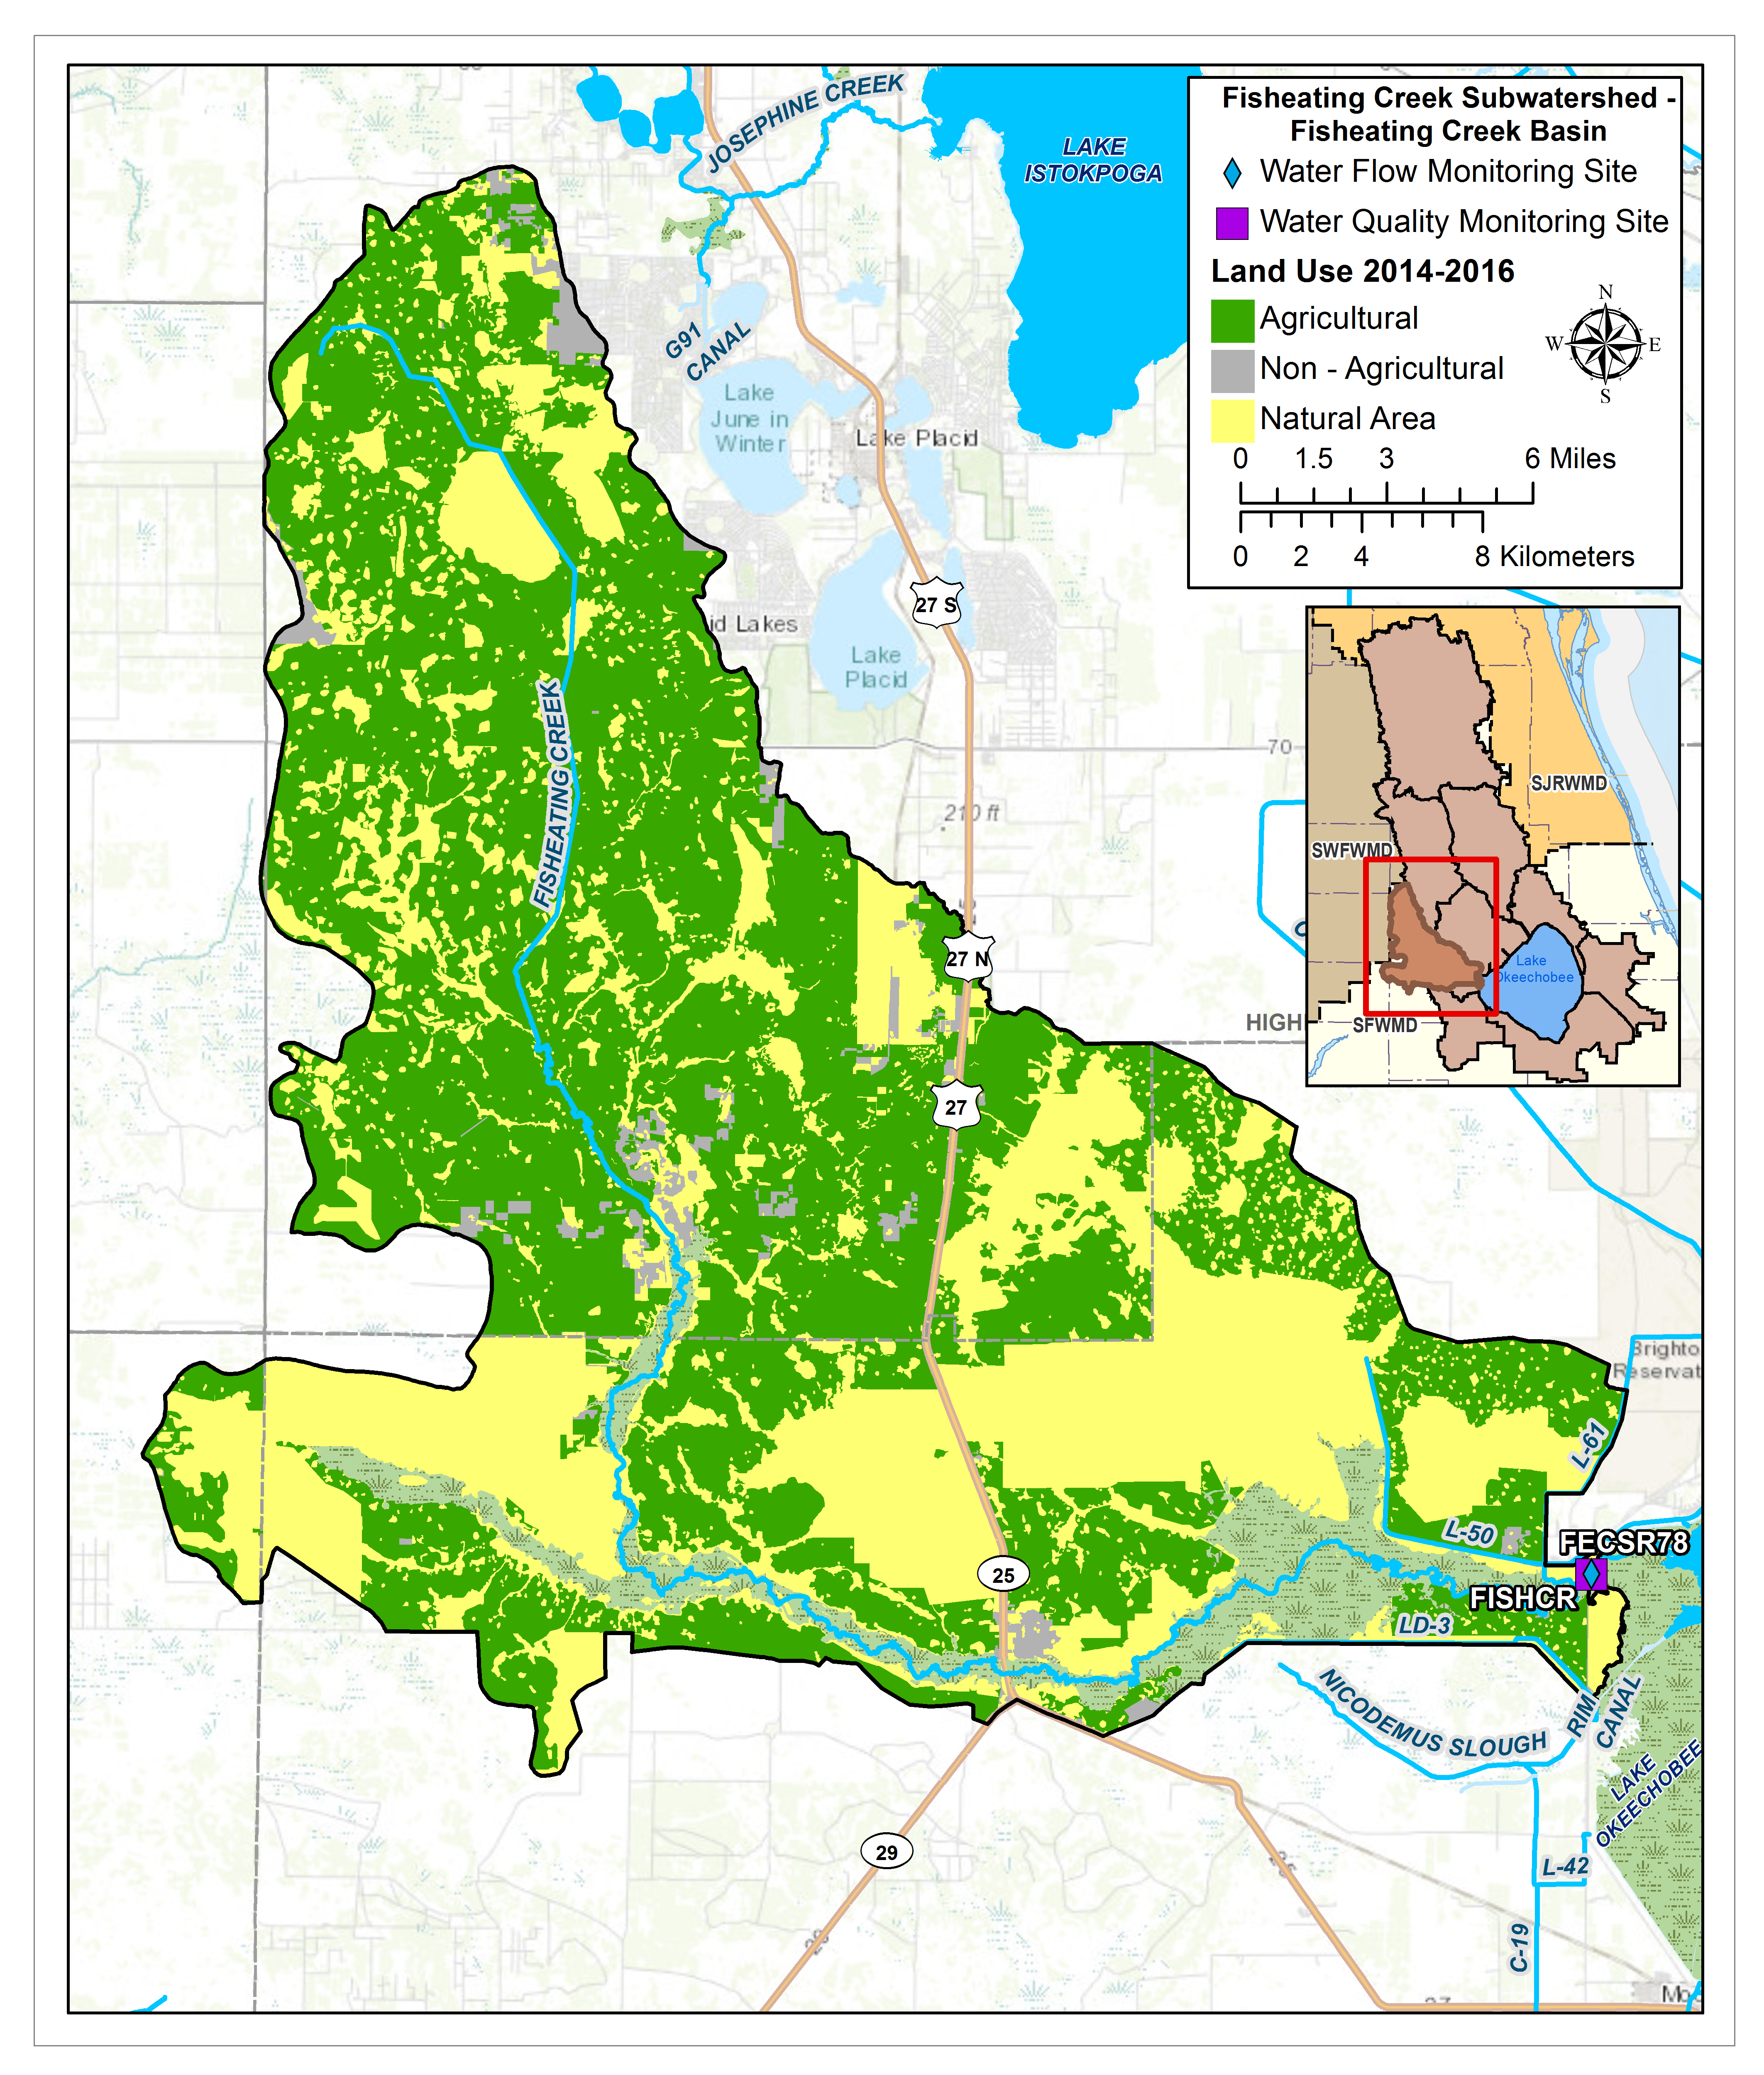
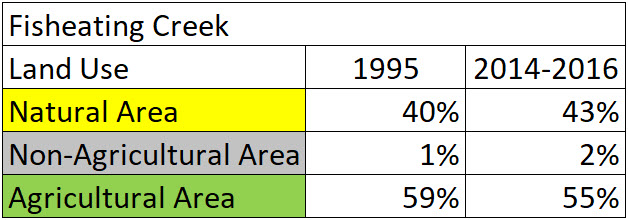
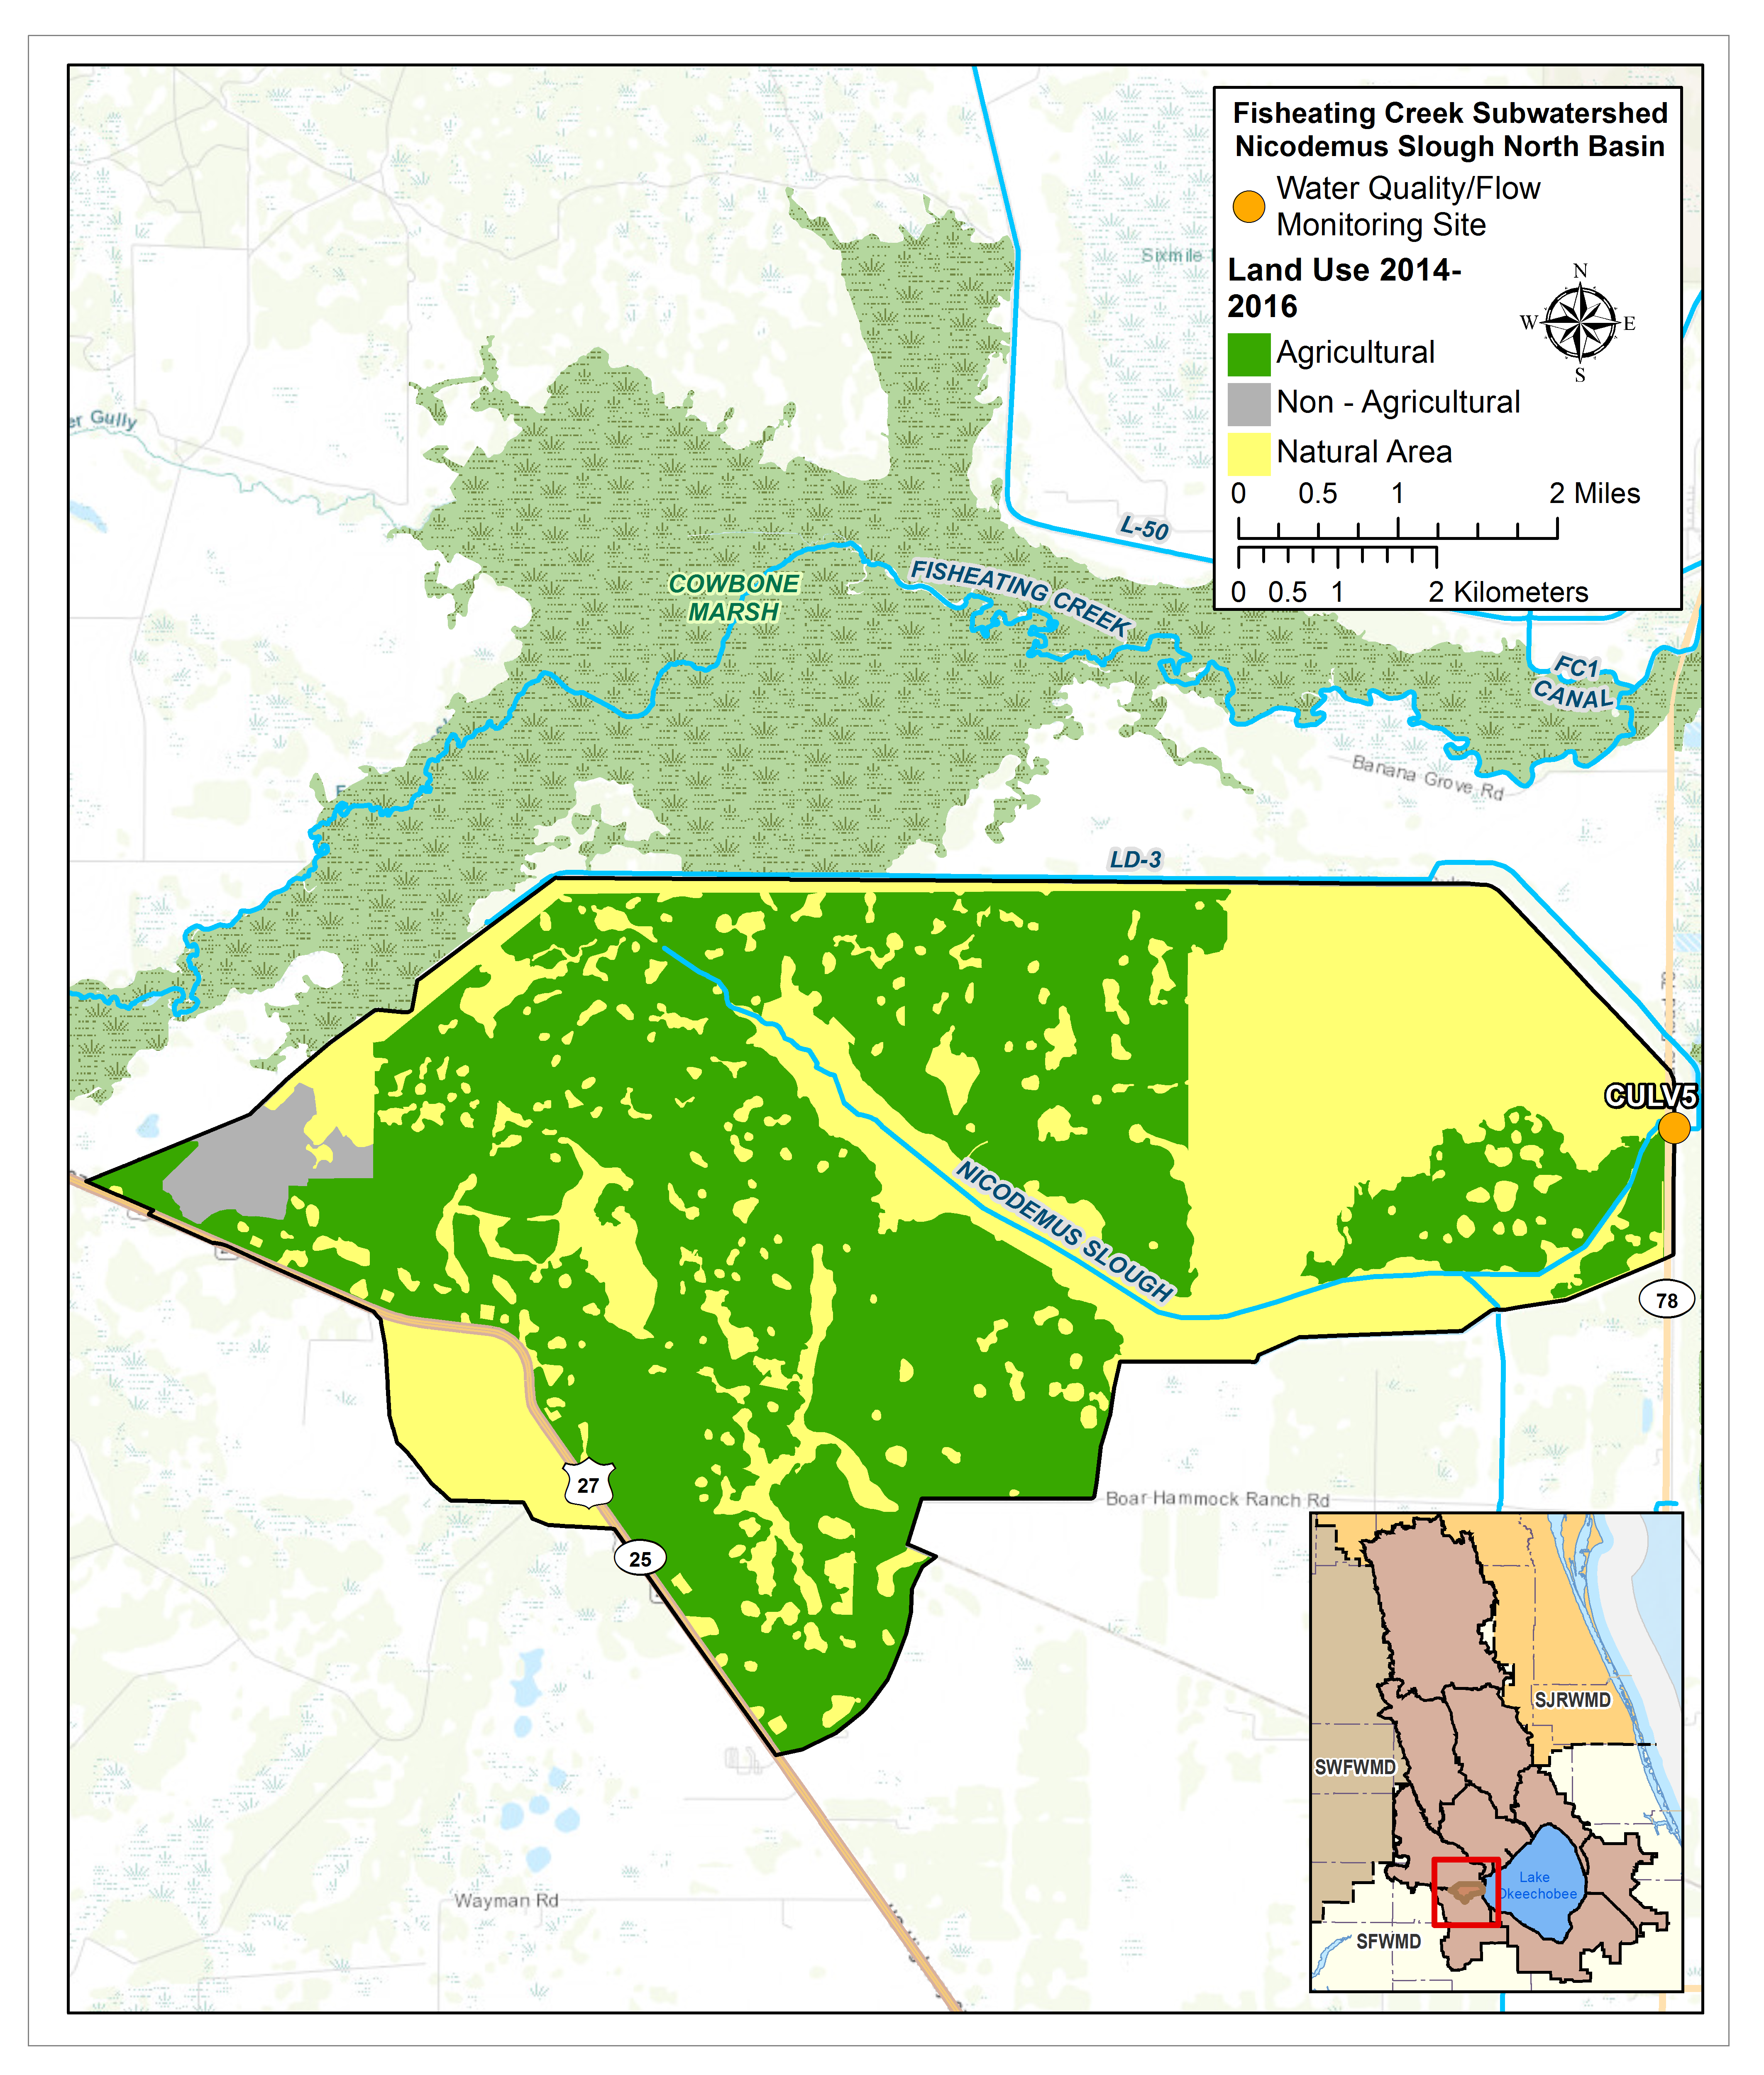
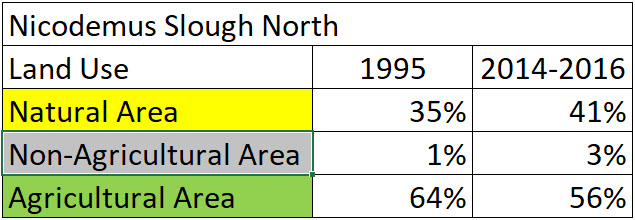
FISHEATHING CREEK SUBWATERSHED
Total Area: 318,042ac
% Area of Lake Okeechobee Watershed: 9.2%
% TP Load of Lake Okeechobee Watershed: 12.3%
Monitoring Locations: FISHCR, FECSR78, CULV5
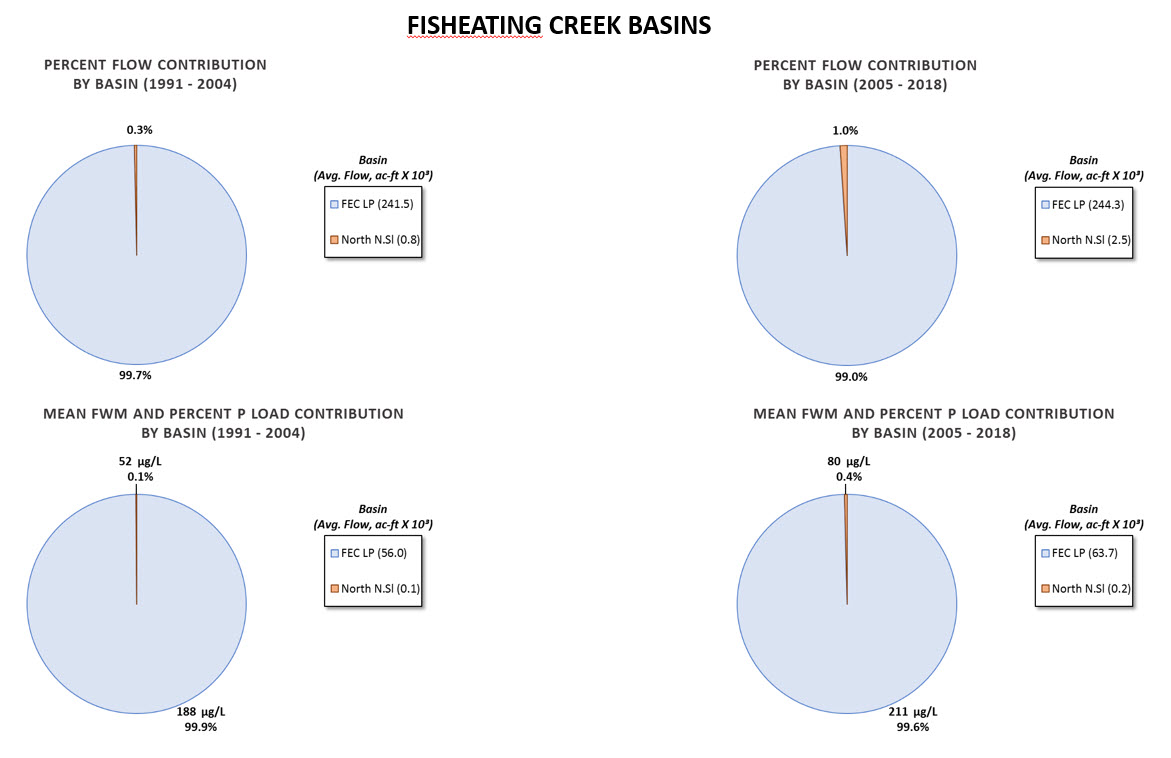
Flow Issues: Maybe
- Fisheating Creek (Lakeport) Basin: Flow measurements did not start at this location until WY1998. Prior to WY1998, flow was measured at Palmdale which is 12 miles upstream. To account for this change, data from the L-61W plus the Palmdale location were used for flows and loads for the period prior to WY1998 for the statistical analysis in this technical sheet.
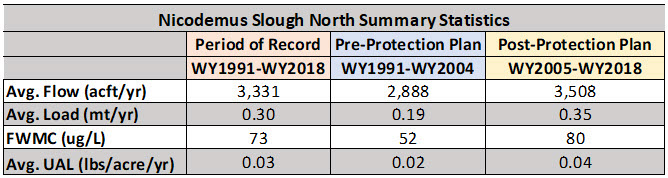
- Nicodemus Slough North: The flow measurement data did not start until 2008. Flow data are inconsistent. Prior to WY1995 flows were estimated. No measurements from WY1995-WY2008. WY2008 flow measurements began. The USACE is began working on Culvert 5 in WY2017 and the discharge is blocked.
- The flow is not monitored at a structure at the Fisheating Creek Basin. Monitoring is located within a flood plain, therefore it is not known if all flows are accounted for in the Fisheating Creek Basin. Suggest looking at individual flow readings at Palmdale and Lakeport to investigate.
- There were no statistically significant trends detected.
- It should be noted that there was a change in flow measurement methods during the period of record for both the Fisheating Creek and the Nicodemus Slough Basins.
Water Quality Issues: Yes
- The total phosphorus (TP) flow-weighted mean concentrations (FWMC) of 210 μg/L in post-protection plan period is relatively high.
- While there are no statistically significant trends in FWMC or TP loads, both had increasing slopes in all three periods. And there was an increase in FWMC and TP load between the pre and post-protection plan period, although it was not significant.
>>Additional Technical Information
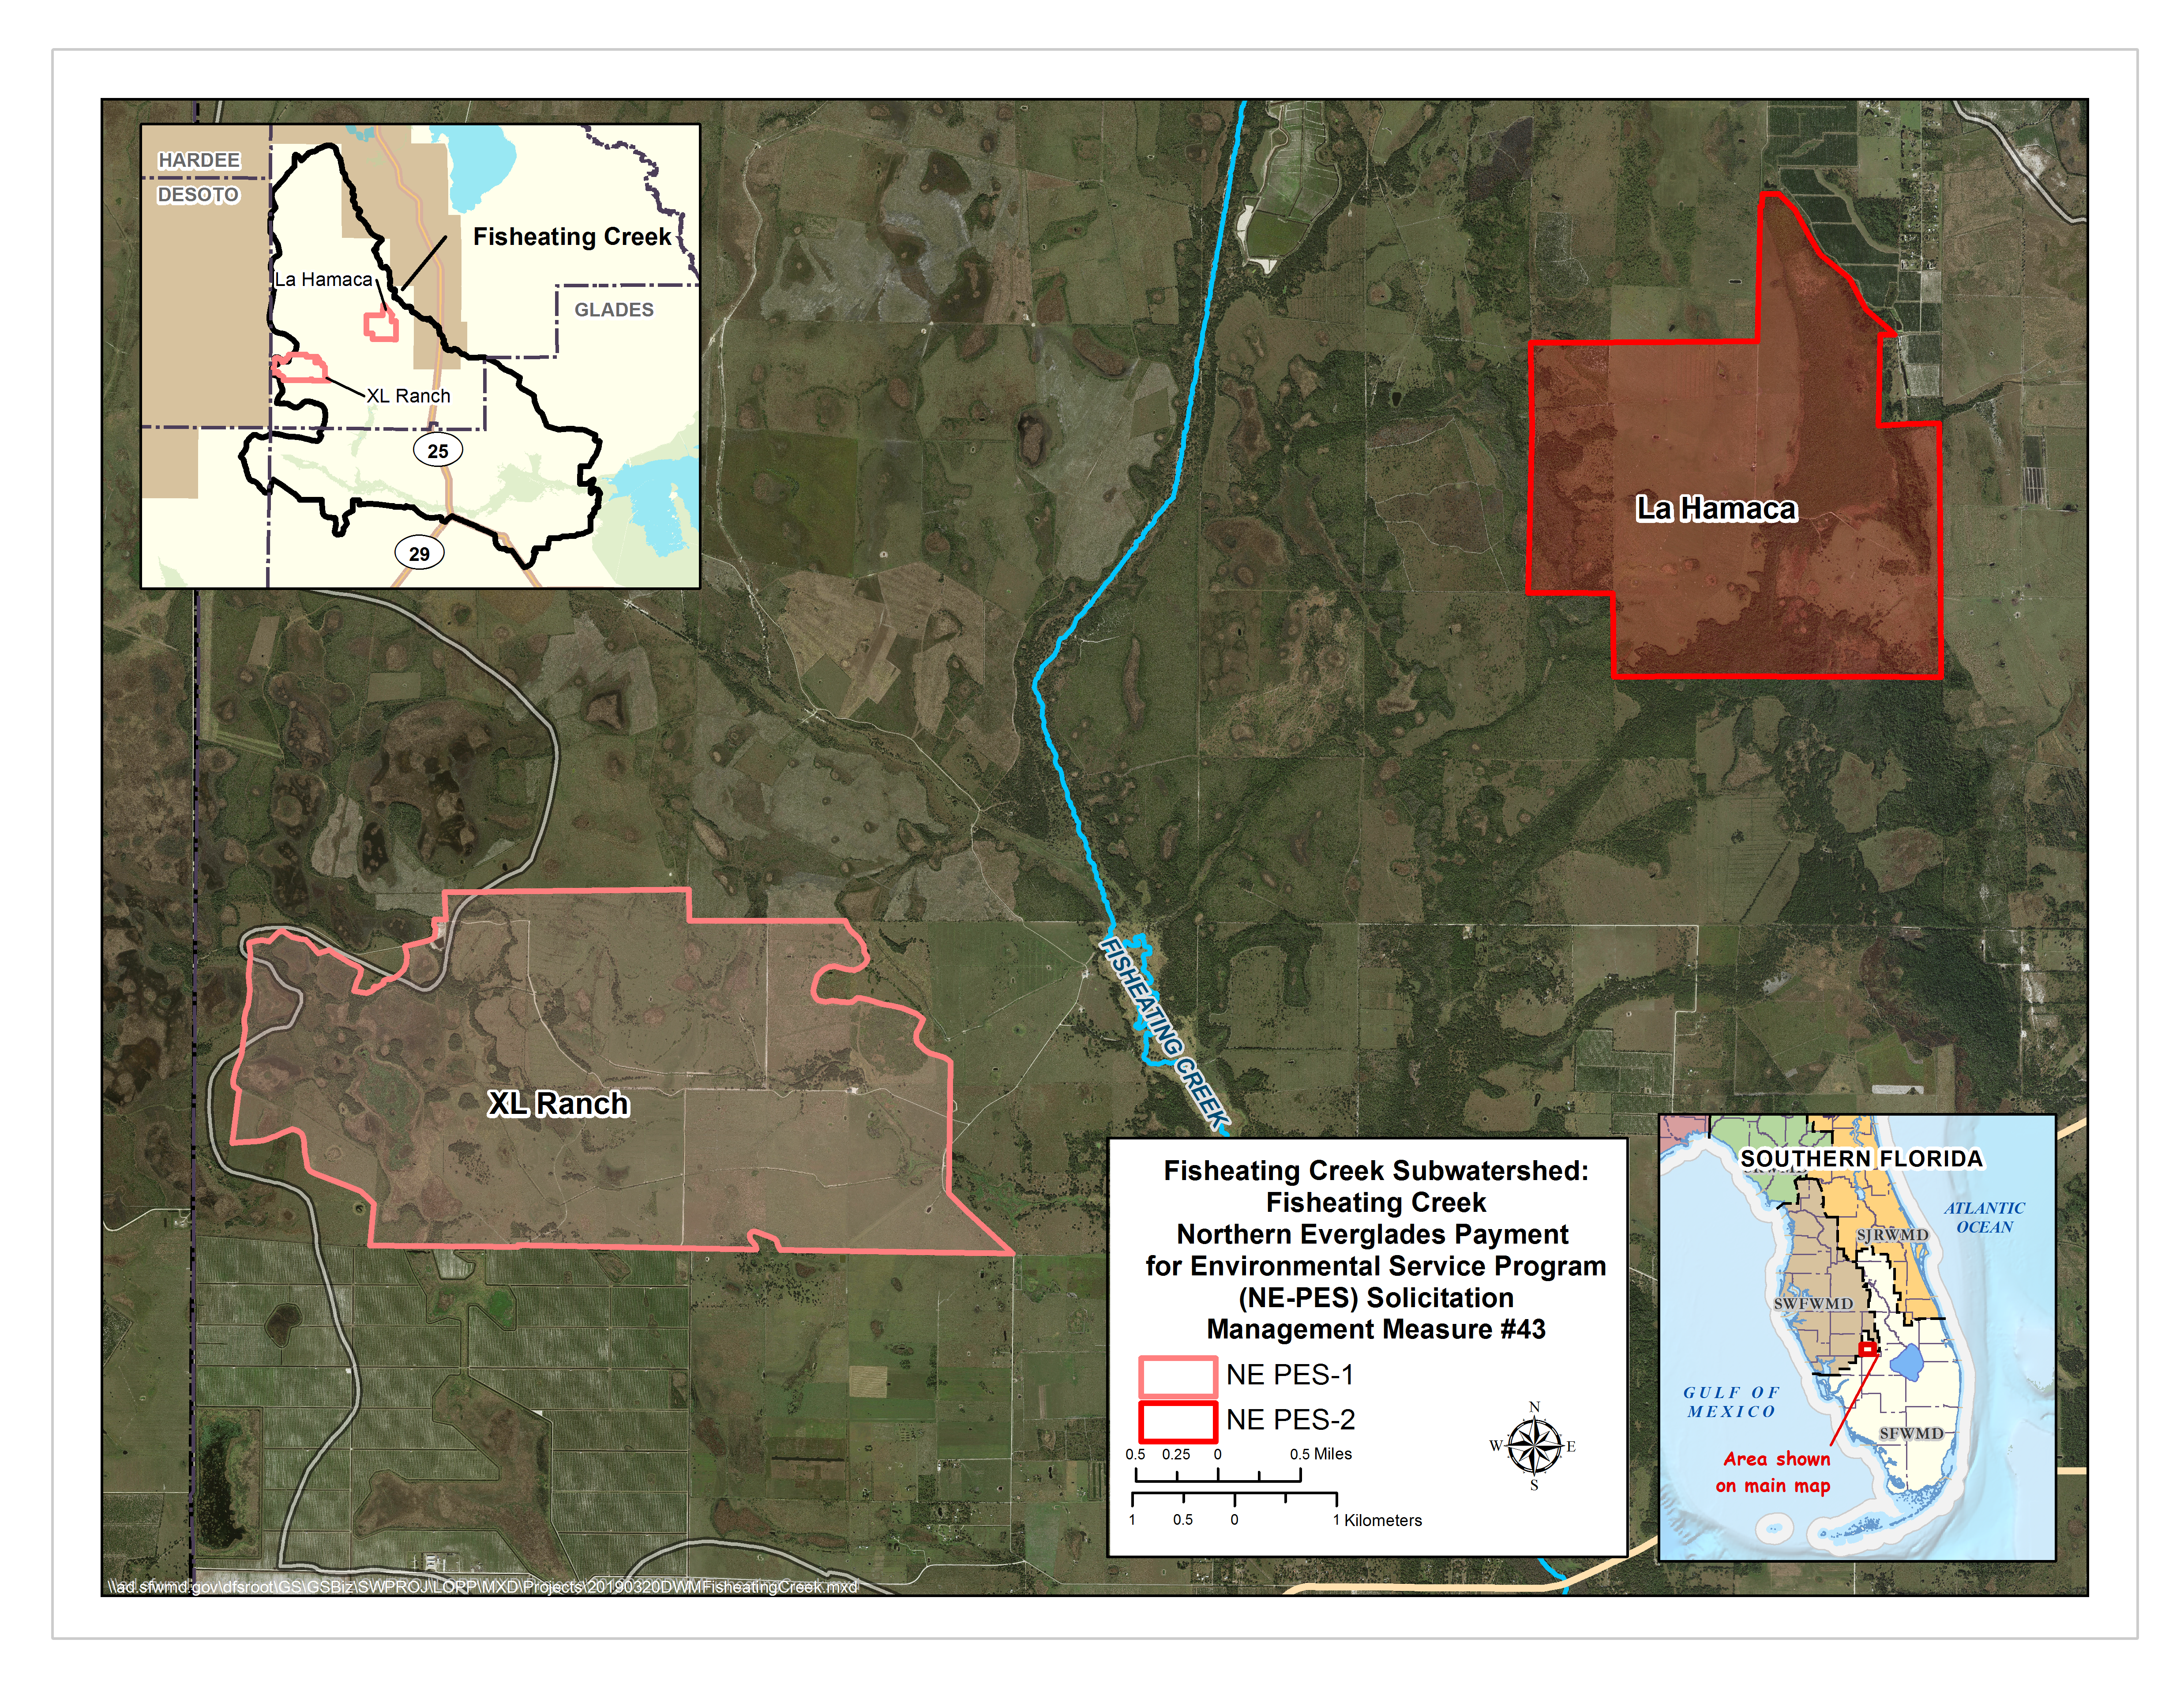
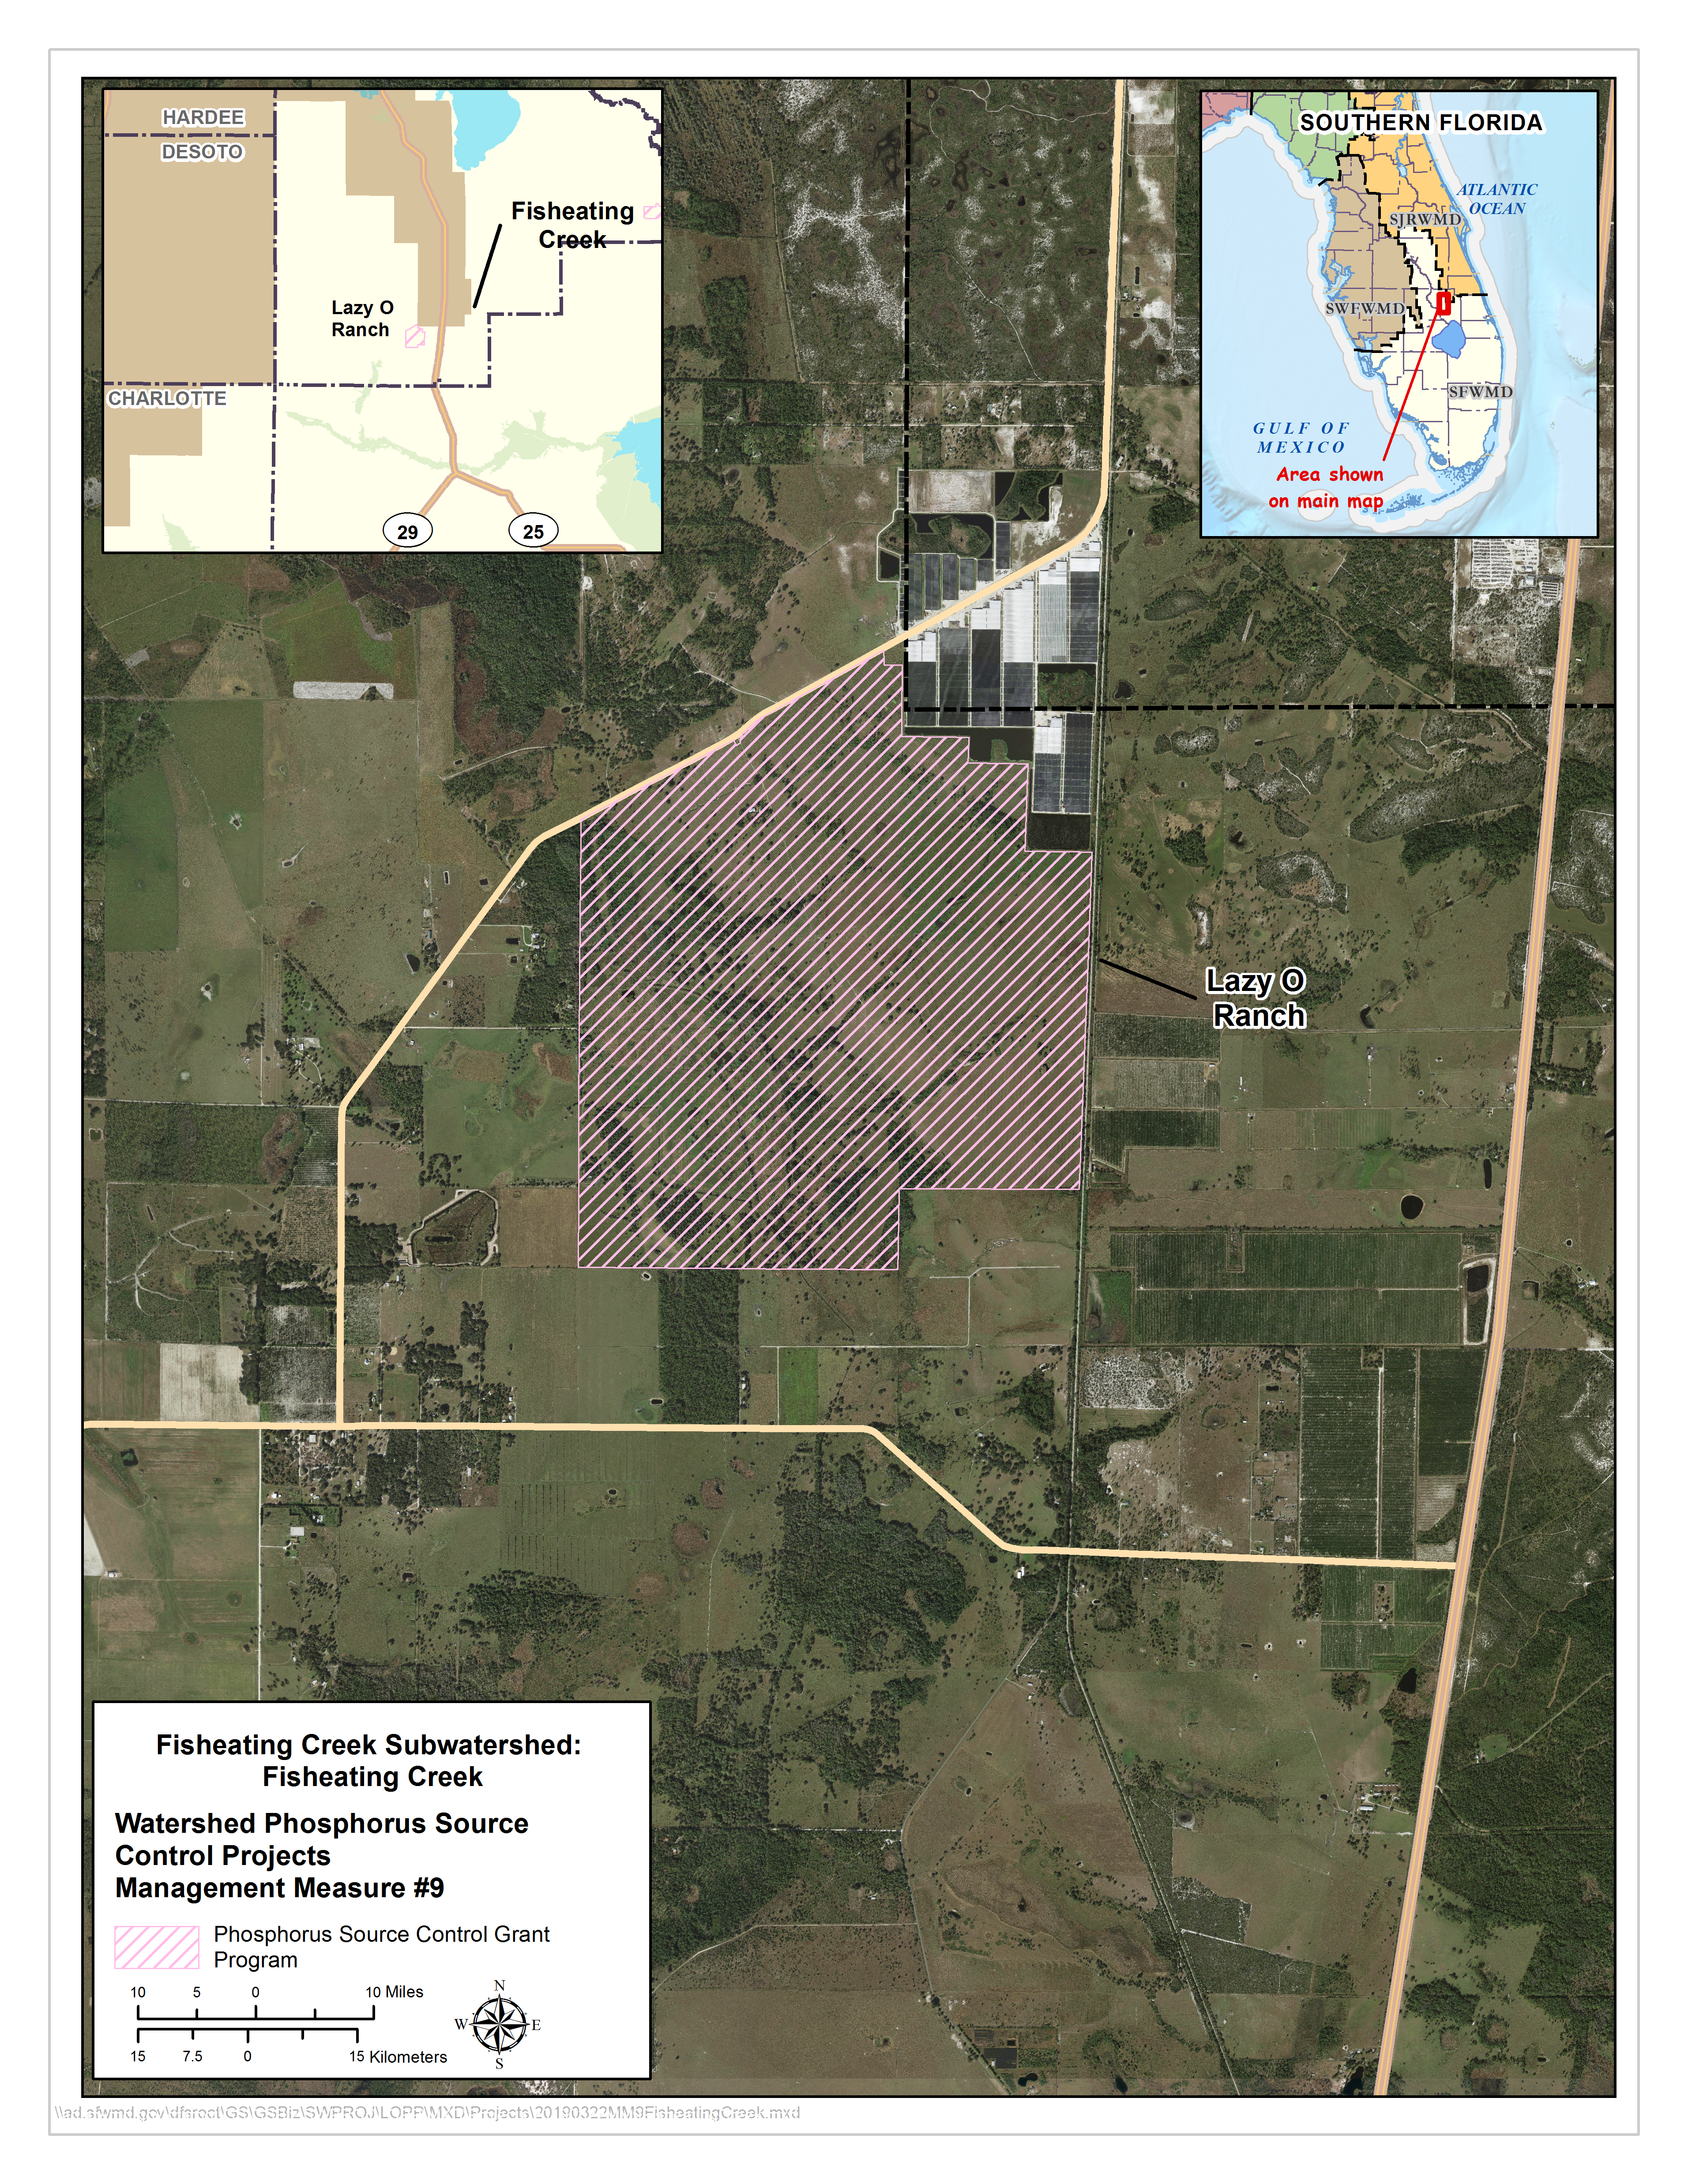
PROJECTS LOCATED IN THIS SUBWATERSHED
FISHEATING CREEK BASIN
Total Area: 298,713ac
% Area of Subwatershed: 94%
% TP Load of Lake Okeechobee Watershed: 99.5%
Monitoring Locations: FISHCR, FECSR78
Flow Issues: Maybe
- The flow is not monitored at a structure at the Fisheating Creek Basin. Monitoring is located within a flood plain, therefore it is not known if all flows are accounted for in the Fisheating Creek Basin. Suggest looking at individual flow readings at Palmdale and Lakeport to investigate.
- There were no statistically significant trends detected.
- It should be noted that there was a change in flow measurement methods during the period of record for the Fisheating Creek Basin.
Water Quality Issues: Yes
- - The total phosphorus (TP) flow-weighted mean concentrations (FWMC) of 211 μg/L in post-protection plan period is relatively high.
- While there are no statistically significant trends in FWMC or TP loads, both had increasing slopes in all three periods. And there was an increase in FWMC and TP load between the pre and post-protection plan period, although it was not significant.
>>Additional Technical Information
PROJECTS LOCATED IN THIS BASIN
 Purpose: Provide shallow storage, retention and detention to enhance Lake Okeechobee and estuary health by reducing discharge volumes, reducing nutrient loading to downstream receiving waters, and expanding groundwater recharge opportunities.
 Purpose: Evaluate, engineer, and rehabilitate the PL-566 water control structures in the Fisheating Creek Marsh Watershed project area to more effectively store and manage water and reduce phosphorus runoff from more than 50,000 acres in the headwaters of Fisheating Creek.
 Purpose: Utilize interim facilities for water storage by employing a range of site alternative measures at a number of project sites. Alternatives include construction of on-site measures such as temporary ditch blocks, minor berms, minimal earthwork, wetland restoration, and potential water diversions to the project site using temporary pump facilities.
 Purpose: Reduce phosphorus exports to Lake Okeechobee in the four priority basins (S-65D, S-65E, S-154, and S-191).
NICODEMUS SLOUGH BASIN
Total Area: 19,329ac
% Area of Subwatershed: 6%
% TP Load of Lake Okeechobee Watershed: 0.6%
Monitoring Locations: CULV5
Flow Issues: No
- The flow measurement data did not start until 2008. According to Cheol Mo the data are erractic. Prior to WY1995 flows were estimated. No measurements from WY1995-WY2008. WY2008 flow measurements began.The USACE is began working on Culvert 5 in WY2017 and the discharge is blocked.
- The contribution from this basin is minimal to the Fisheating Creek subwatershed.
- The Nicodemus Slough Project covers the majority of the acreage in this basin.
Water Quality Issues: No
- The contribution from this basin is minimal to the Fisheating Creek subwatershed (0.5% of loads in the post-Protection Plan period).
- The Nicodemus Slough Project covers the majority of the acreage in this basin.
>>Additional Technical Information
PROJECTS LOCATED IN THIS BASIN
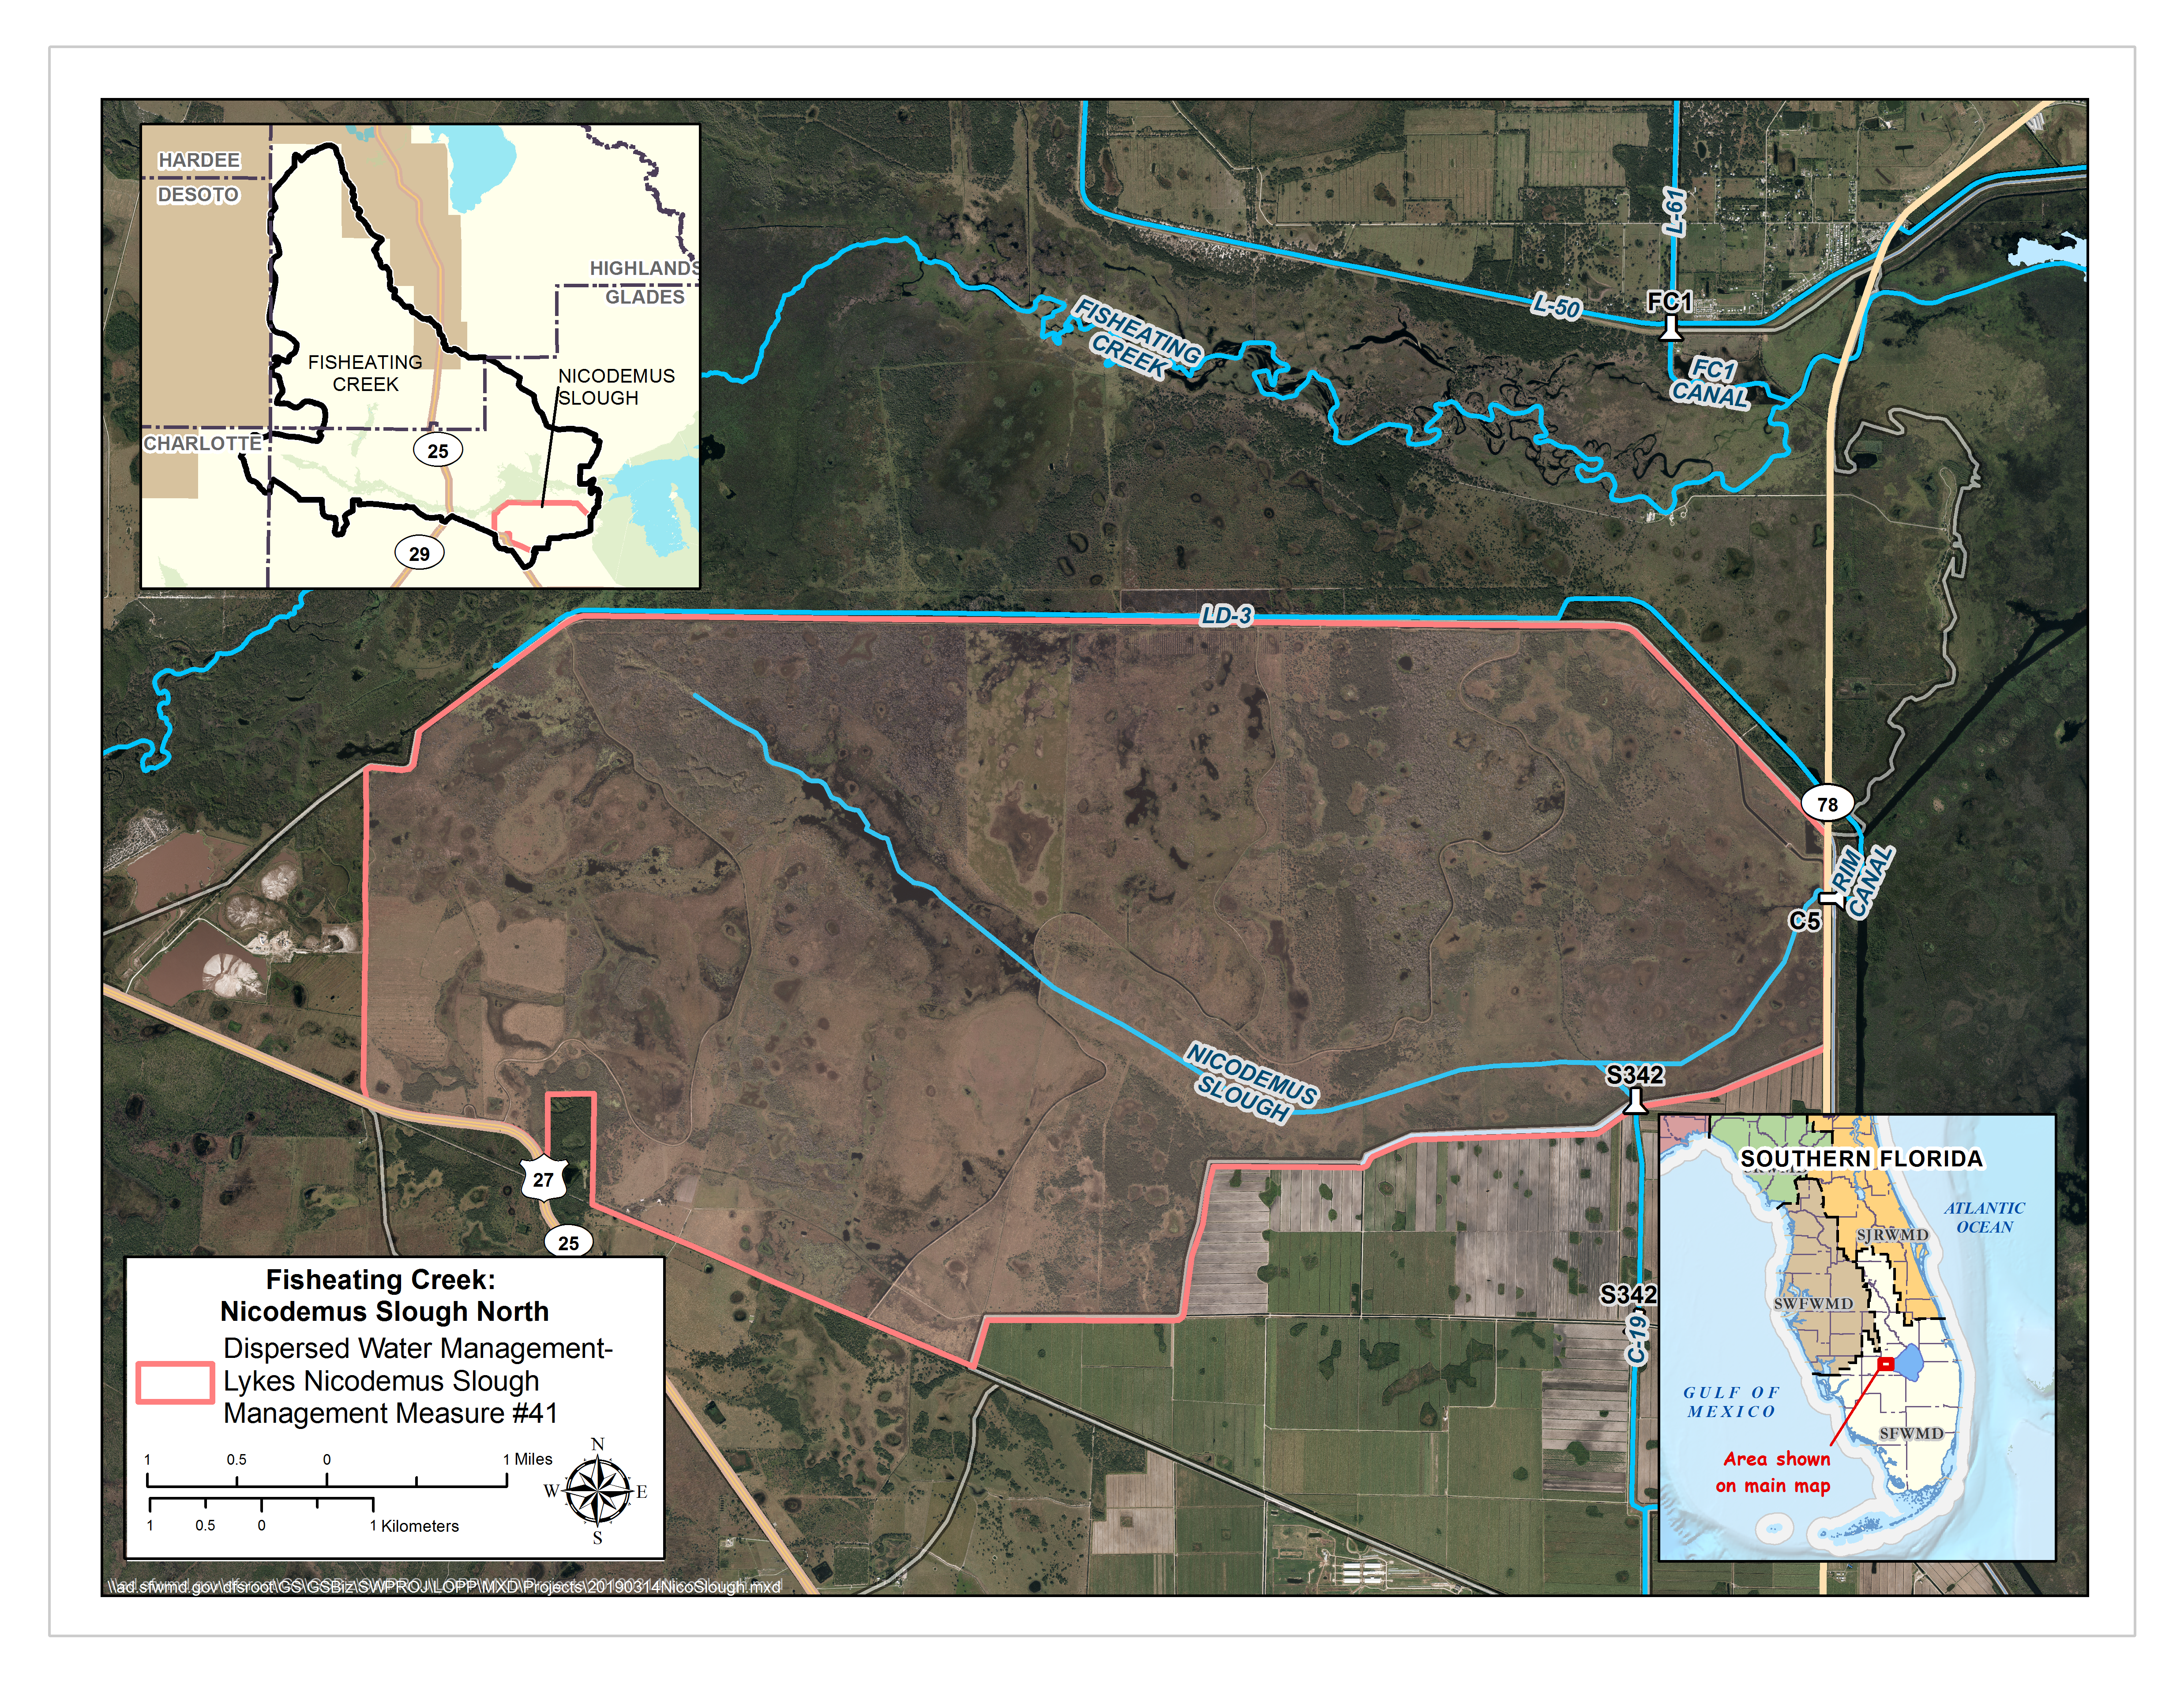 Purpose: Capture/detain surface water from Lake Okeechobee when excess discharges from Lake Okeechobee flow to tide or may cause harm to the Caloosahatchee Estuary and/or Saint Lucie Estuary.
LAKE ISTOKPOGA BASINS
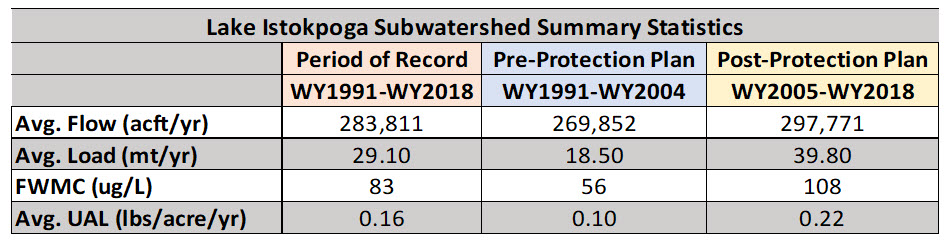
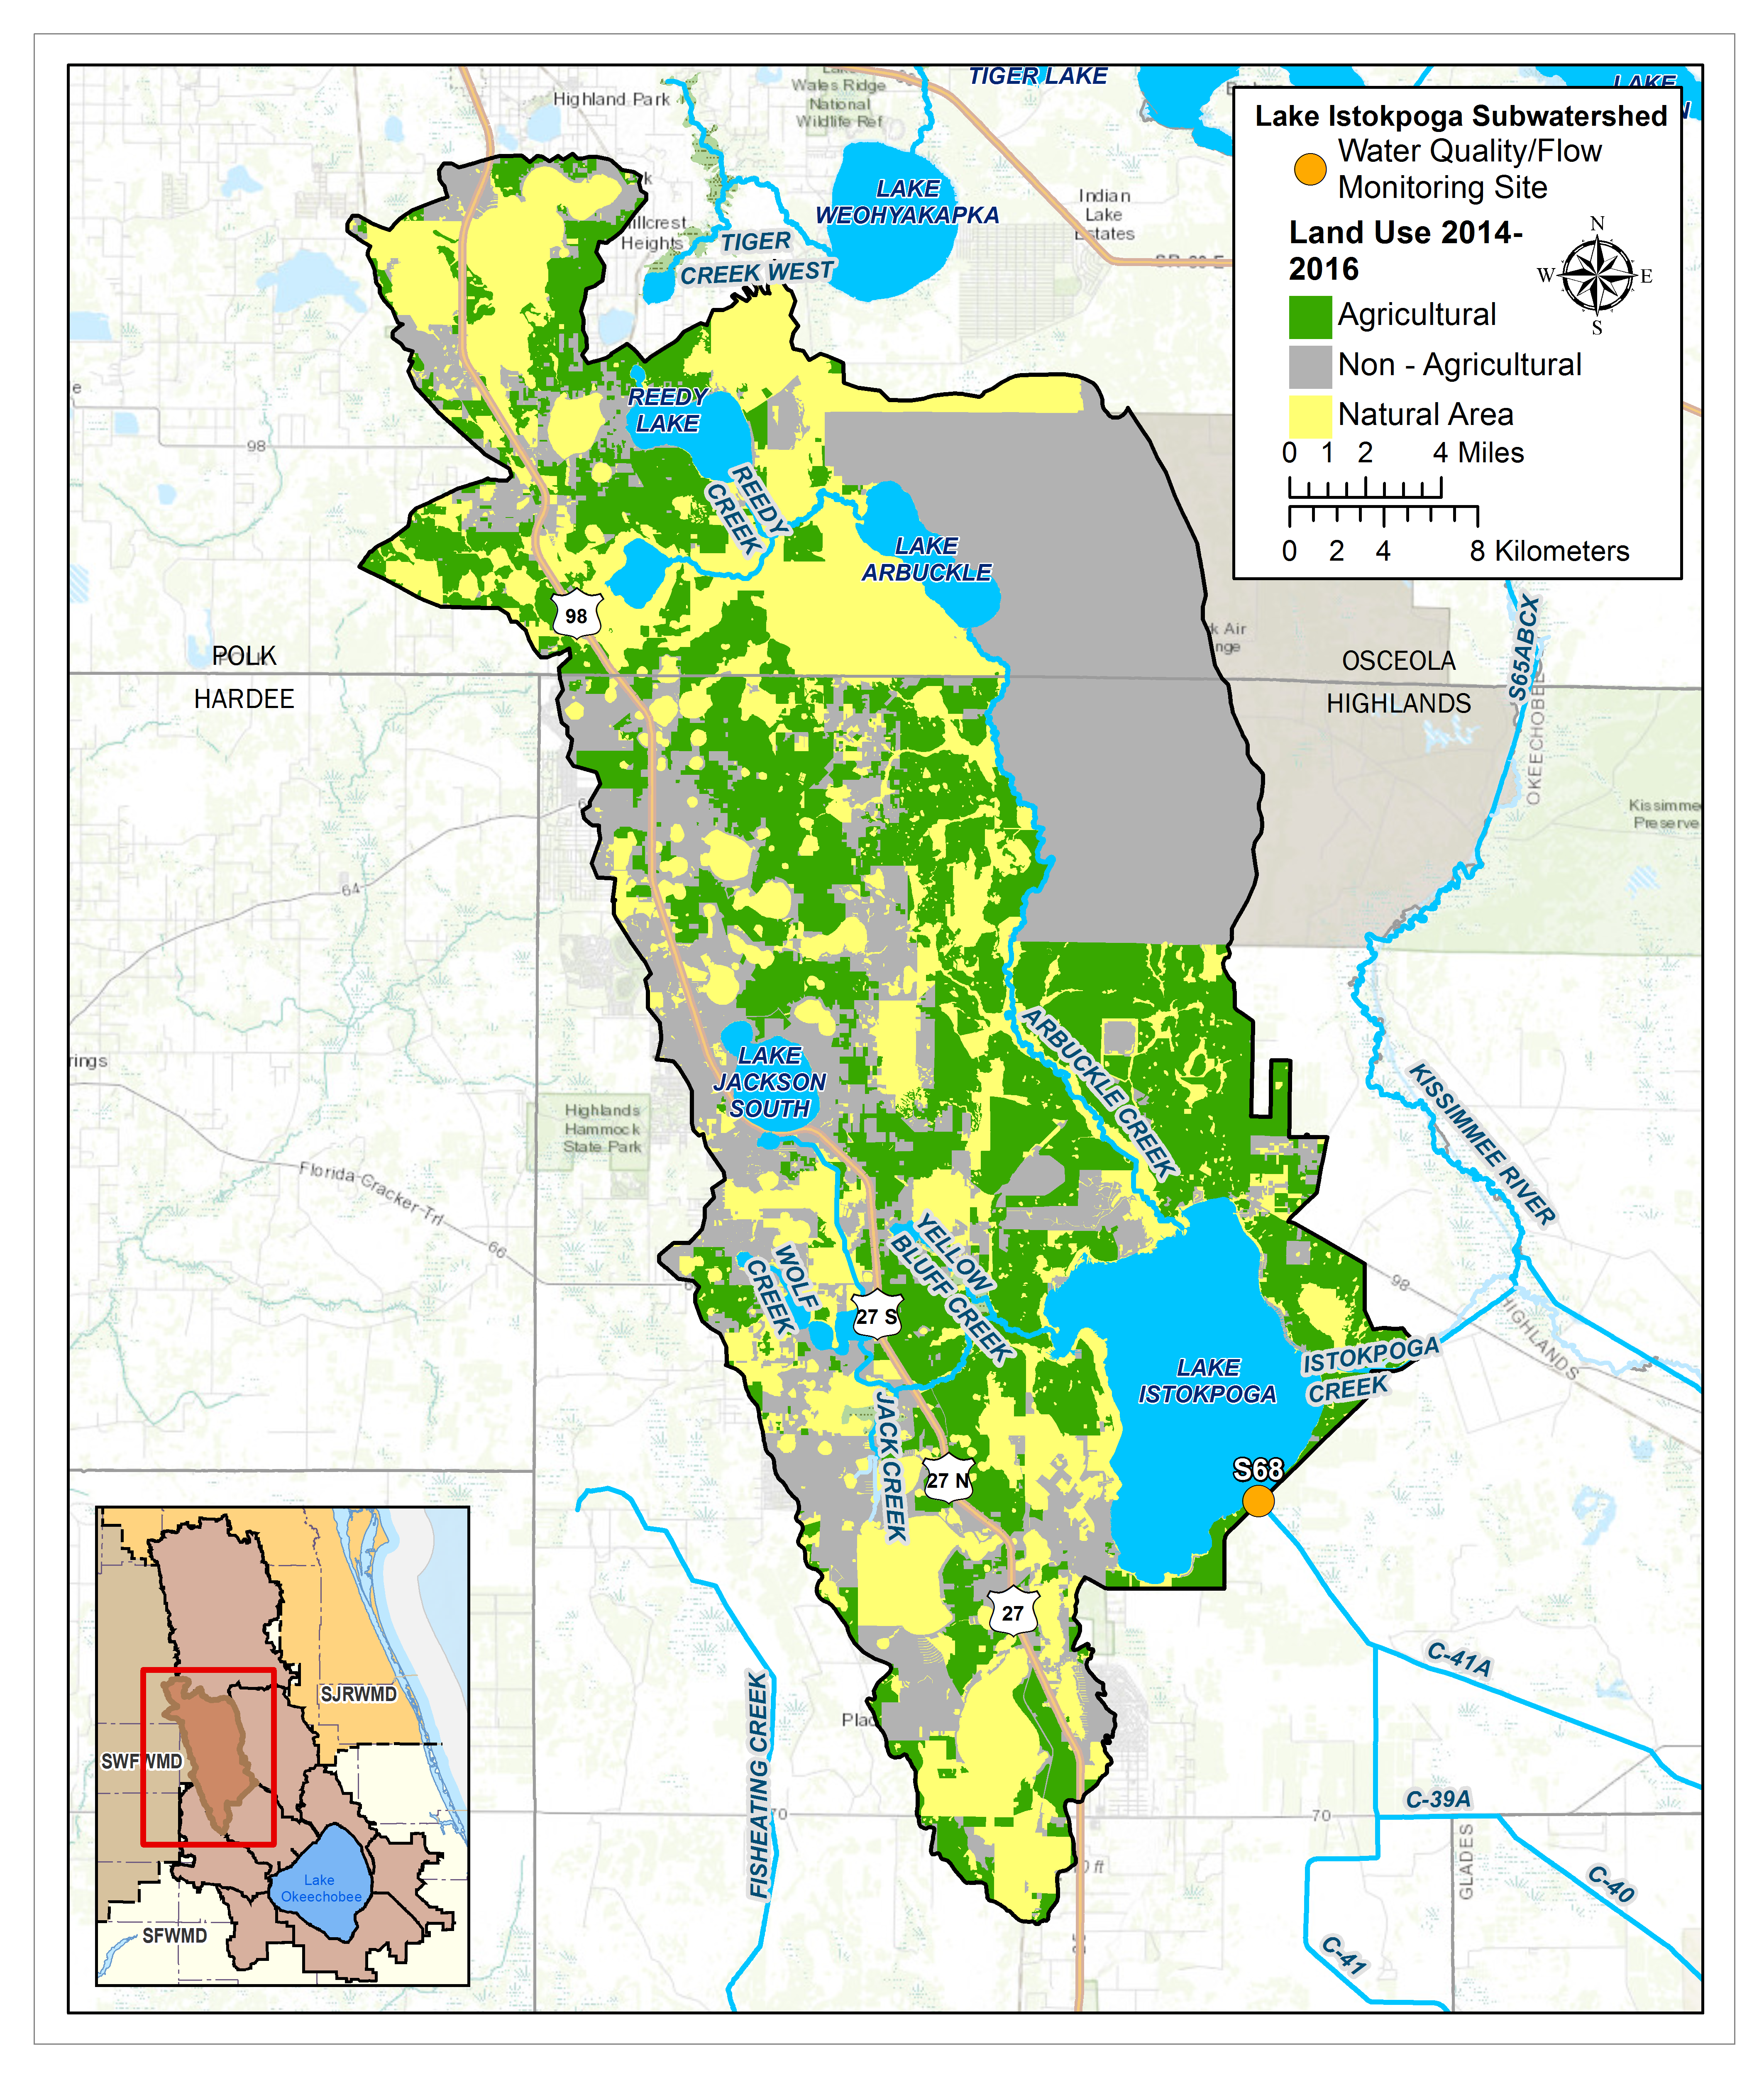
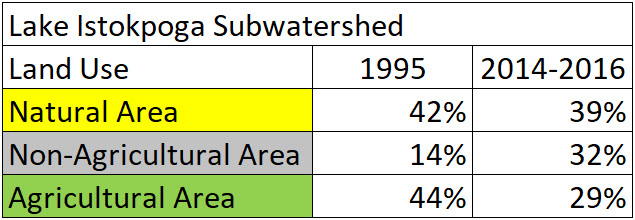
LAKE ISTOKPOGA SUBWATERSHED
Total Area: 394,203ac
% Area of Lake Okeechobee Watershed: 11.4%
% TP Load of Lake Okeechobee Watershed: 7.6%
Monitoring Locations: S68
Flow Issues: Maybe
- Changes in operation or in the S-68 outfall structure may have occurred. Need to investigate further.
- A portion of this subwatershed is outside of the SFWMD boundaries, therefore is out of SFWMD’s control.
Water Quality Issues: Yes
- There was a statistically significant increasing trend in total phosphorus (TP) load and flow-weighted mean concentrations (FWMC) for all periods. There was also a statistically significant increase in FWMC between the pre and post-protection plan period.
- TP Loads and FWMC doubled in post-protection plan period. Although, the post-protection plan TP FWMC is still relatively low at (108 μg/L) and it only contributes 8% of the total load to LOW.
- Lake Istokpoga is immediately upstream of monitoring location; may need to investigate if the samples represent runoff upstream of the lake and to identify sources.
- Need to confirm only grab samples were used for the load calculation due to issues with false triggering of the auto sampler.
>>Additional Technical Information
PROJECTS LOCATED IN THIS SUBWATERSHED
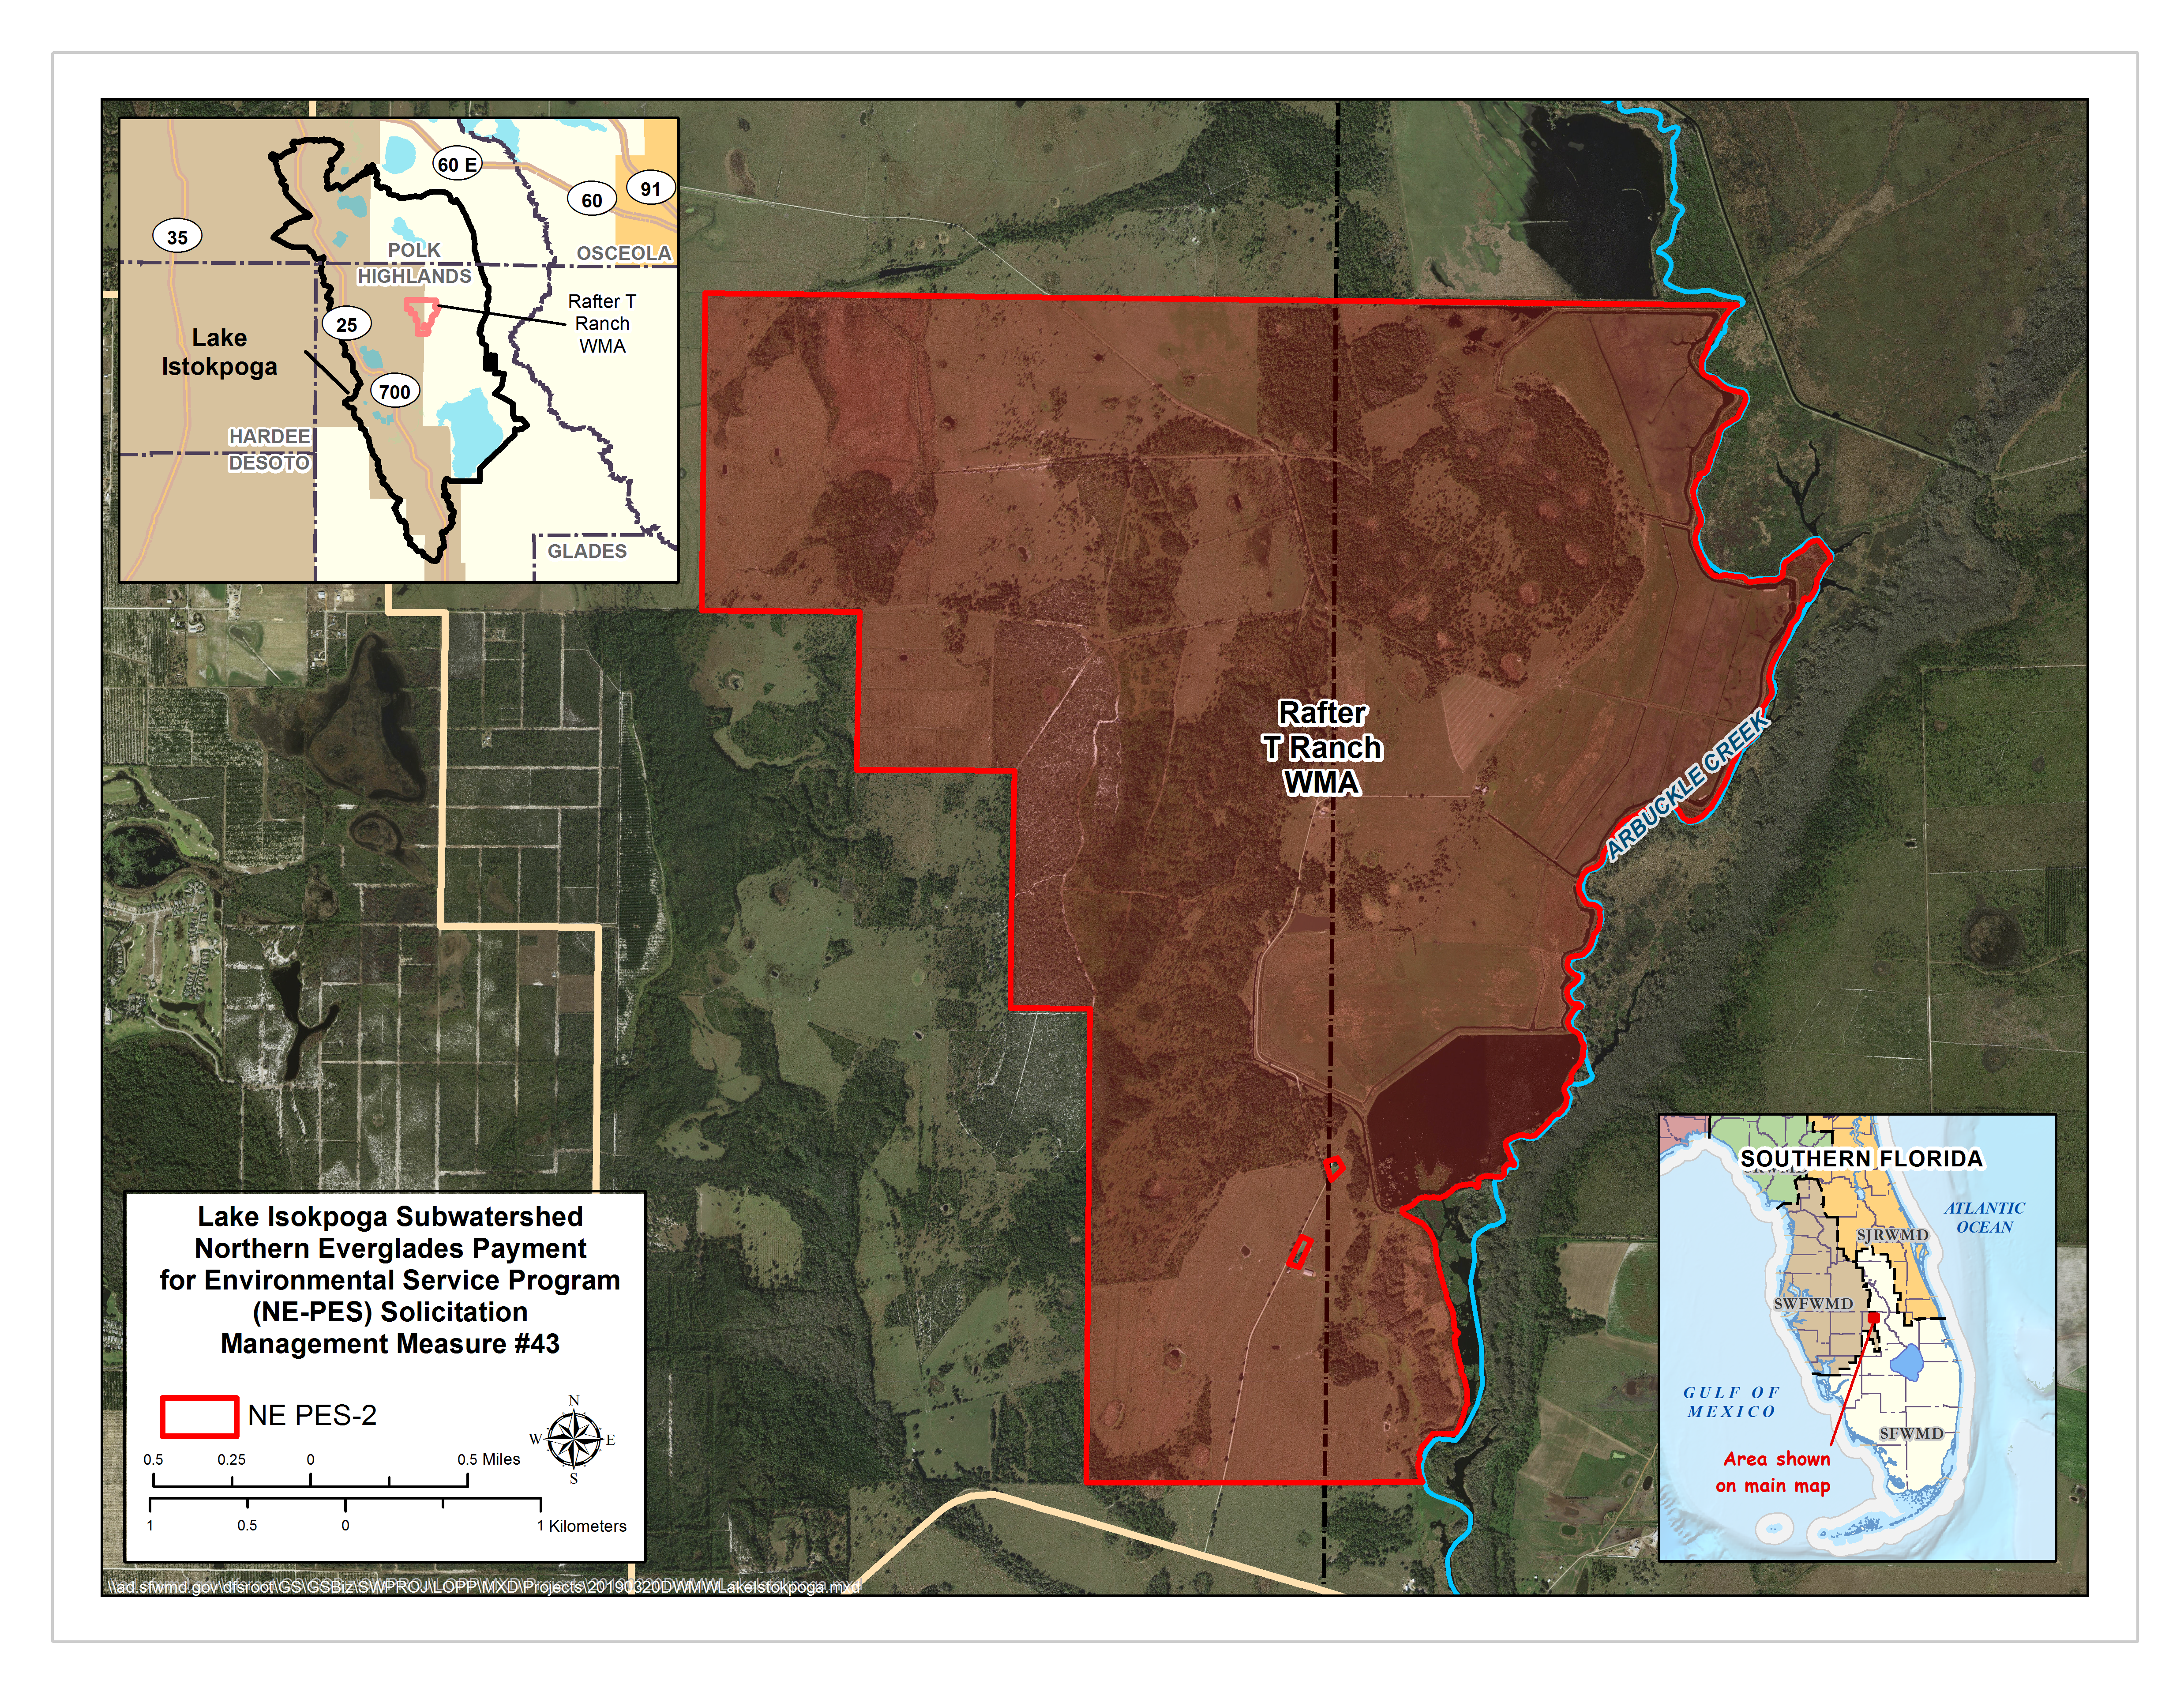 Purpose: Provide shallow storage, retention and detention to enhance Lake Okeechobee and estuary health by reducing discharge volumes, reducing nutrient loading to downstream receiving waters, and expanding groundwater recharge opportunities.
SOUTH LAKE OKEECHOBEE BASINS
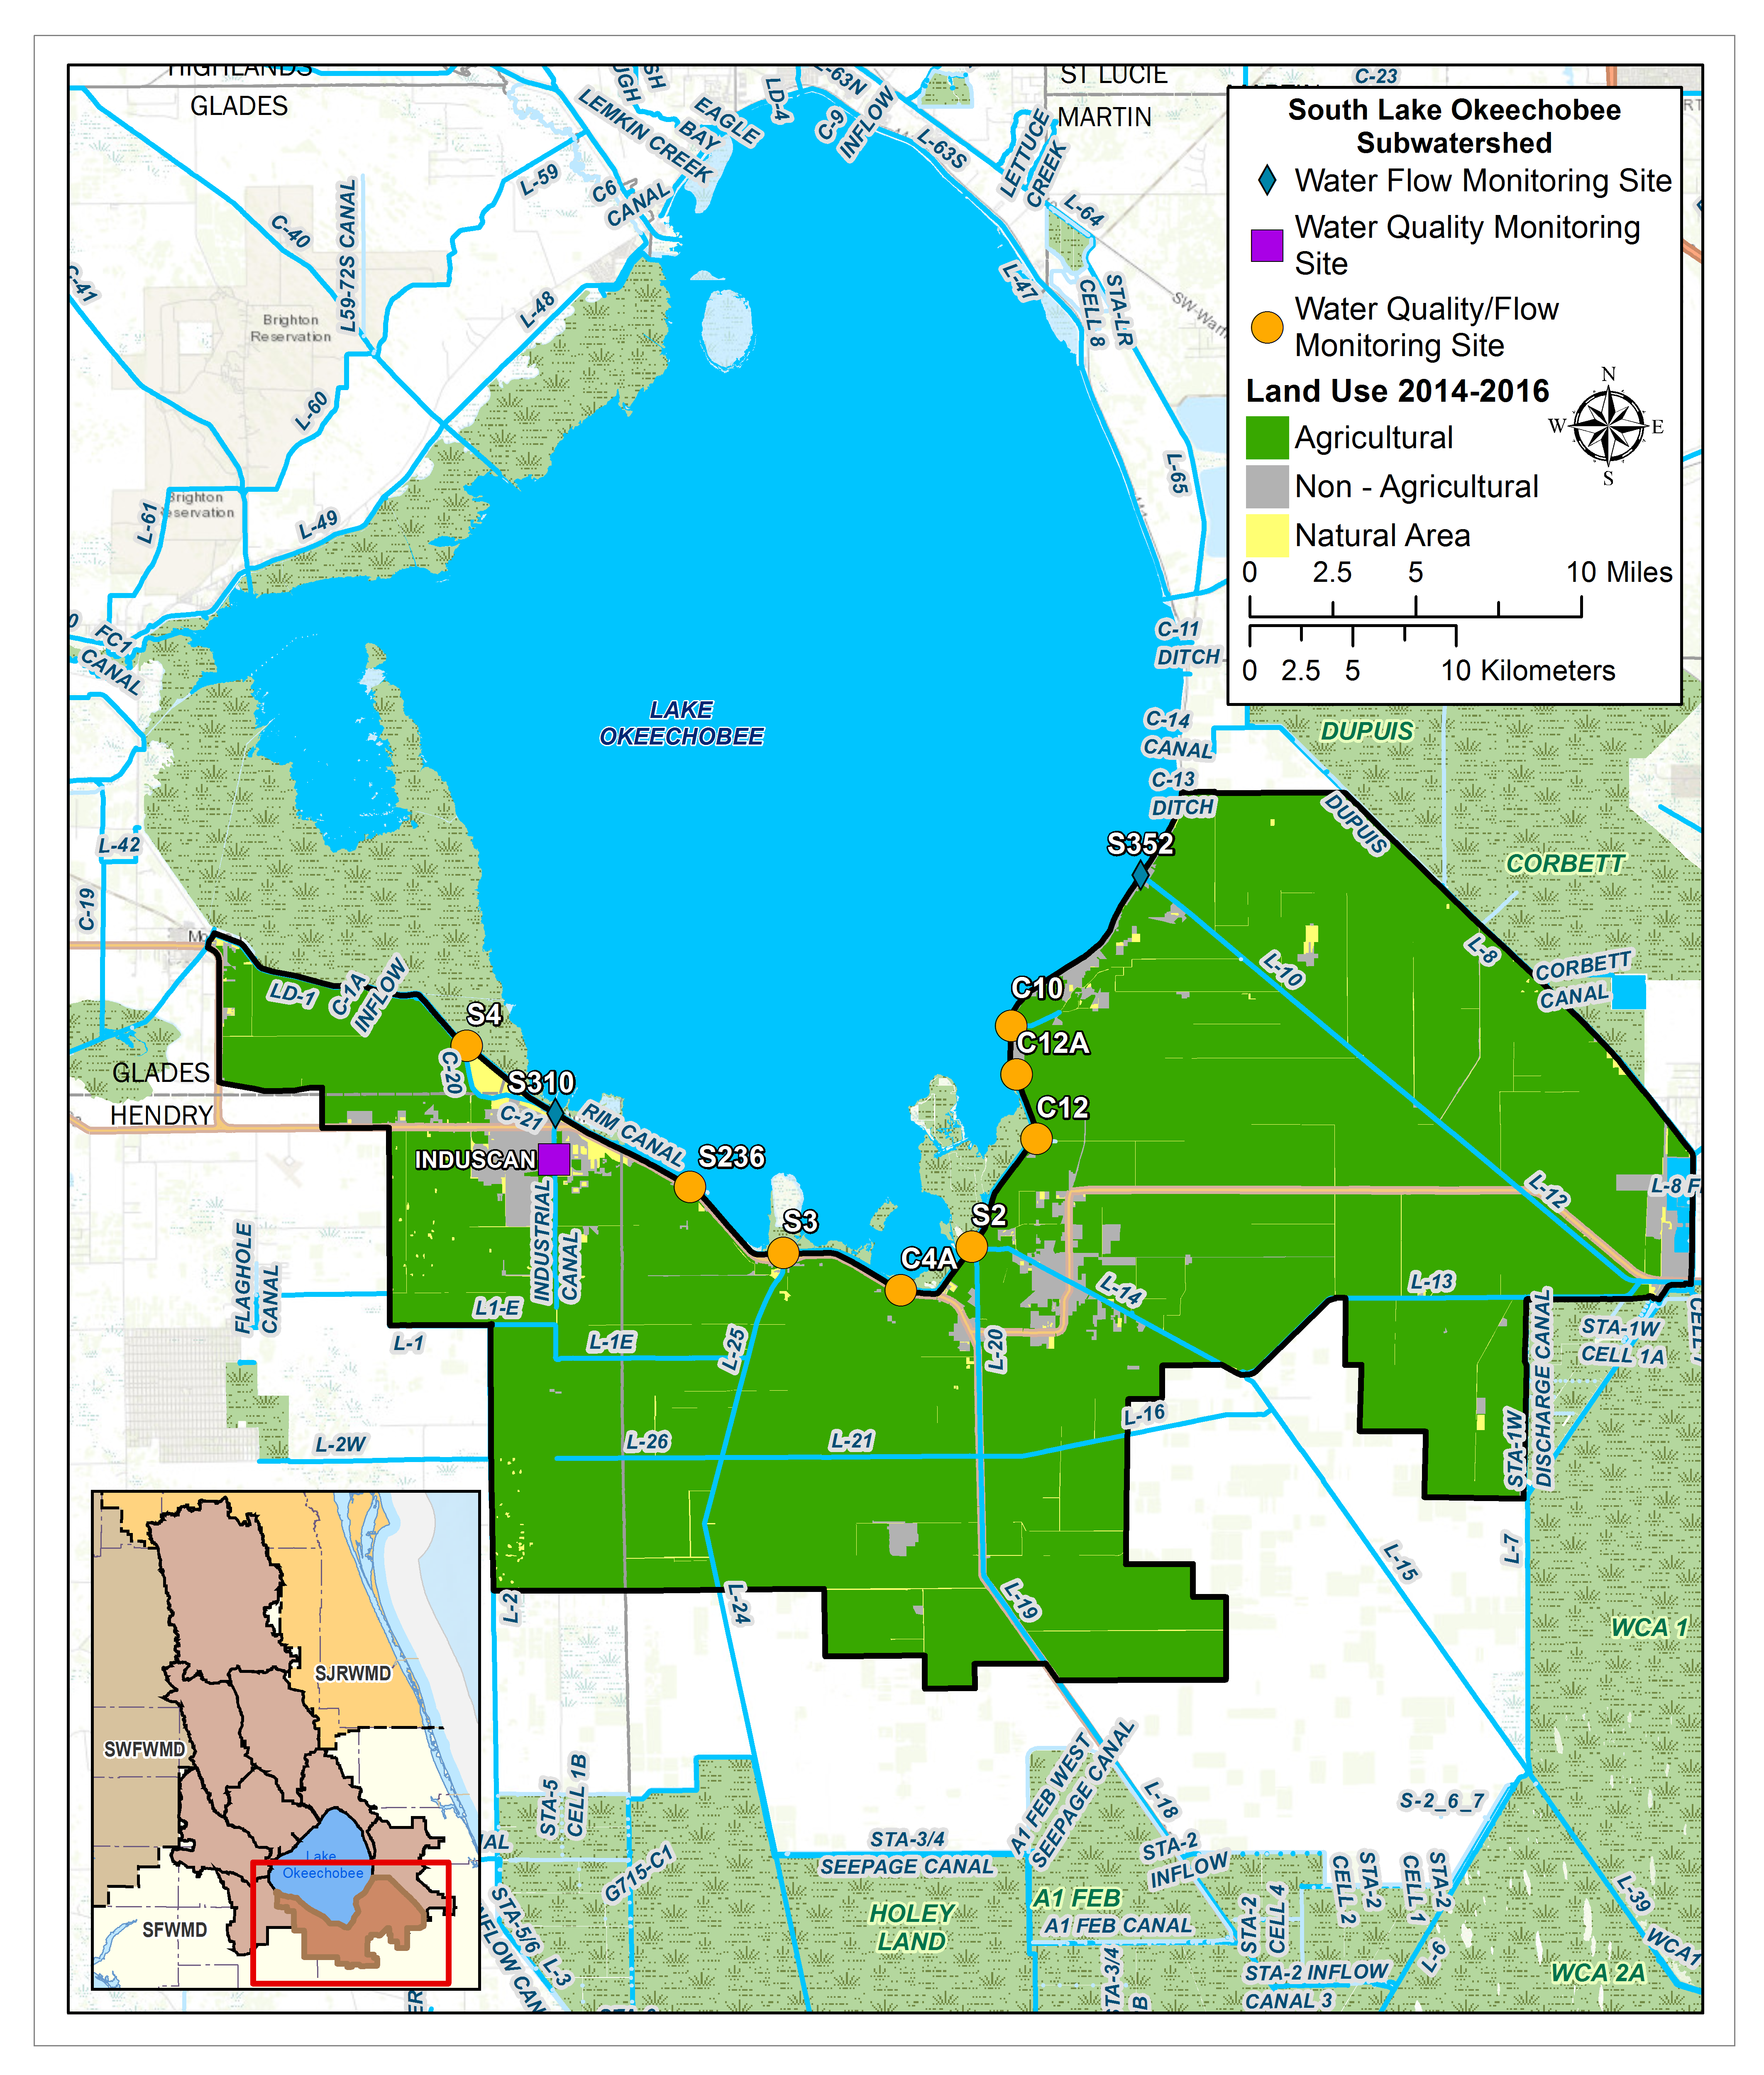
SOUTH LAKE OKEECHOBEE SUBWATERSHED
Total Area: 363,141ac
% Area of Lake Okeechobee Watershed: 10.5%
% TP Load of Lake Okeechobee Watershed: 4.1%
Monitoring Locations: S2, S3, S352, S4, C10, C12A, C12, C4A, S236, S310, INDUSCAN
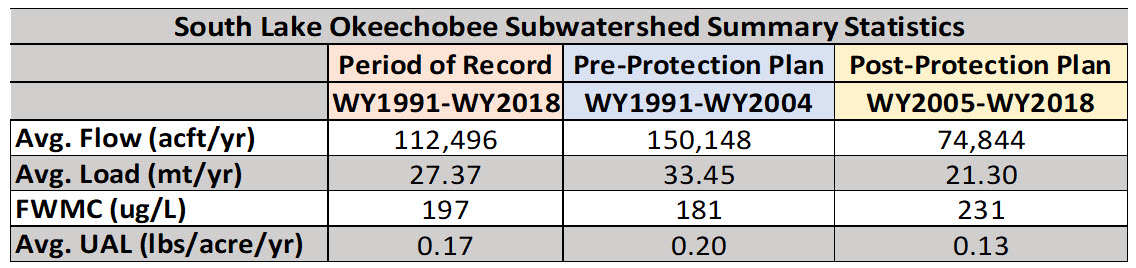
Flow Issues: No
- Flows from the South subwatershed represented only 3% of total inflows to Lake Okeechobee during the post-protection plan period. Flow and load evaluations were conducted based only on that portion of the flow that discharges from the South Lake Okeechobee subwatershed into Lake Okeechobee. There was a statistically significant decrease between pre and post-protection plan median flows. There was also a statistically significant decreasing trend for flow for the period of record.
Water Quality Issues: No
- The South subwatershed contributed only 4% of all total phosphorus (TP) loads discharged into the lake during the post-protection plan period. In addition, a statistically significant decreasing trend in TP load was found for the period of record.

>>Additional Technical Information
PROJECTS LOCATED IN THIS SUBWATERSHED
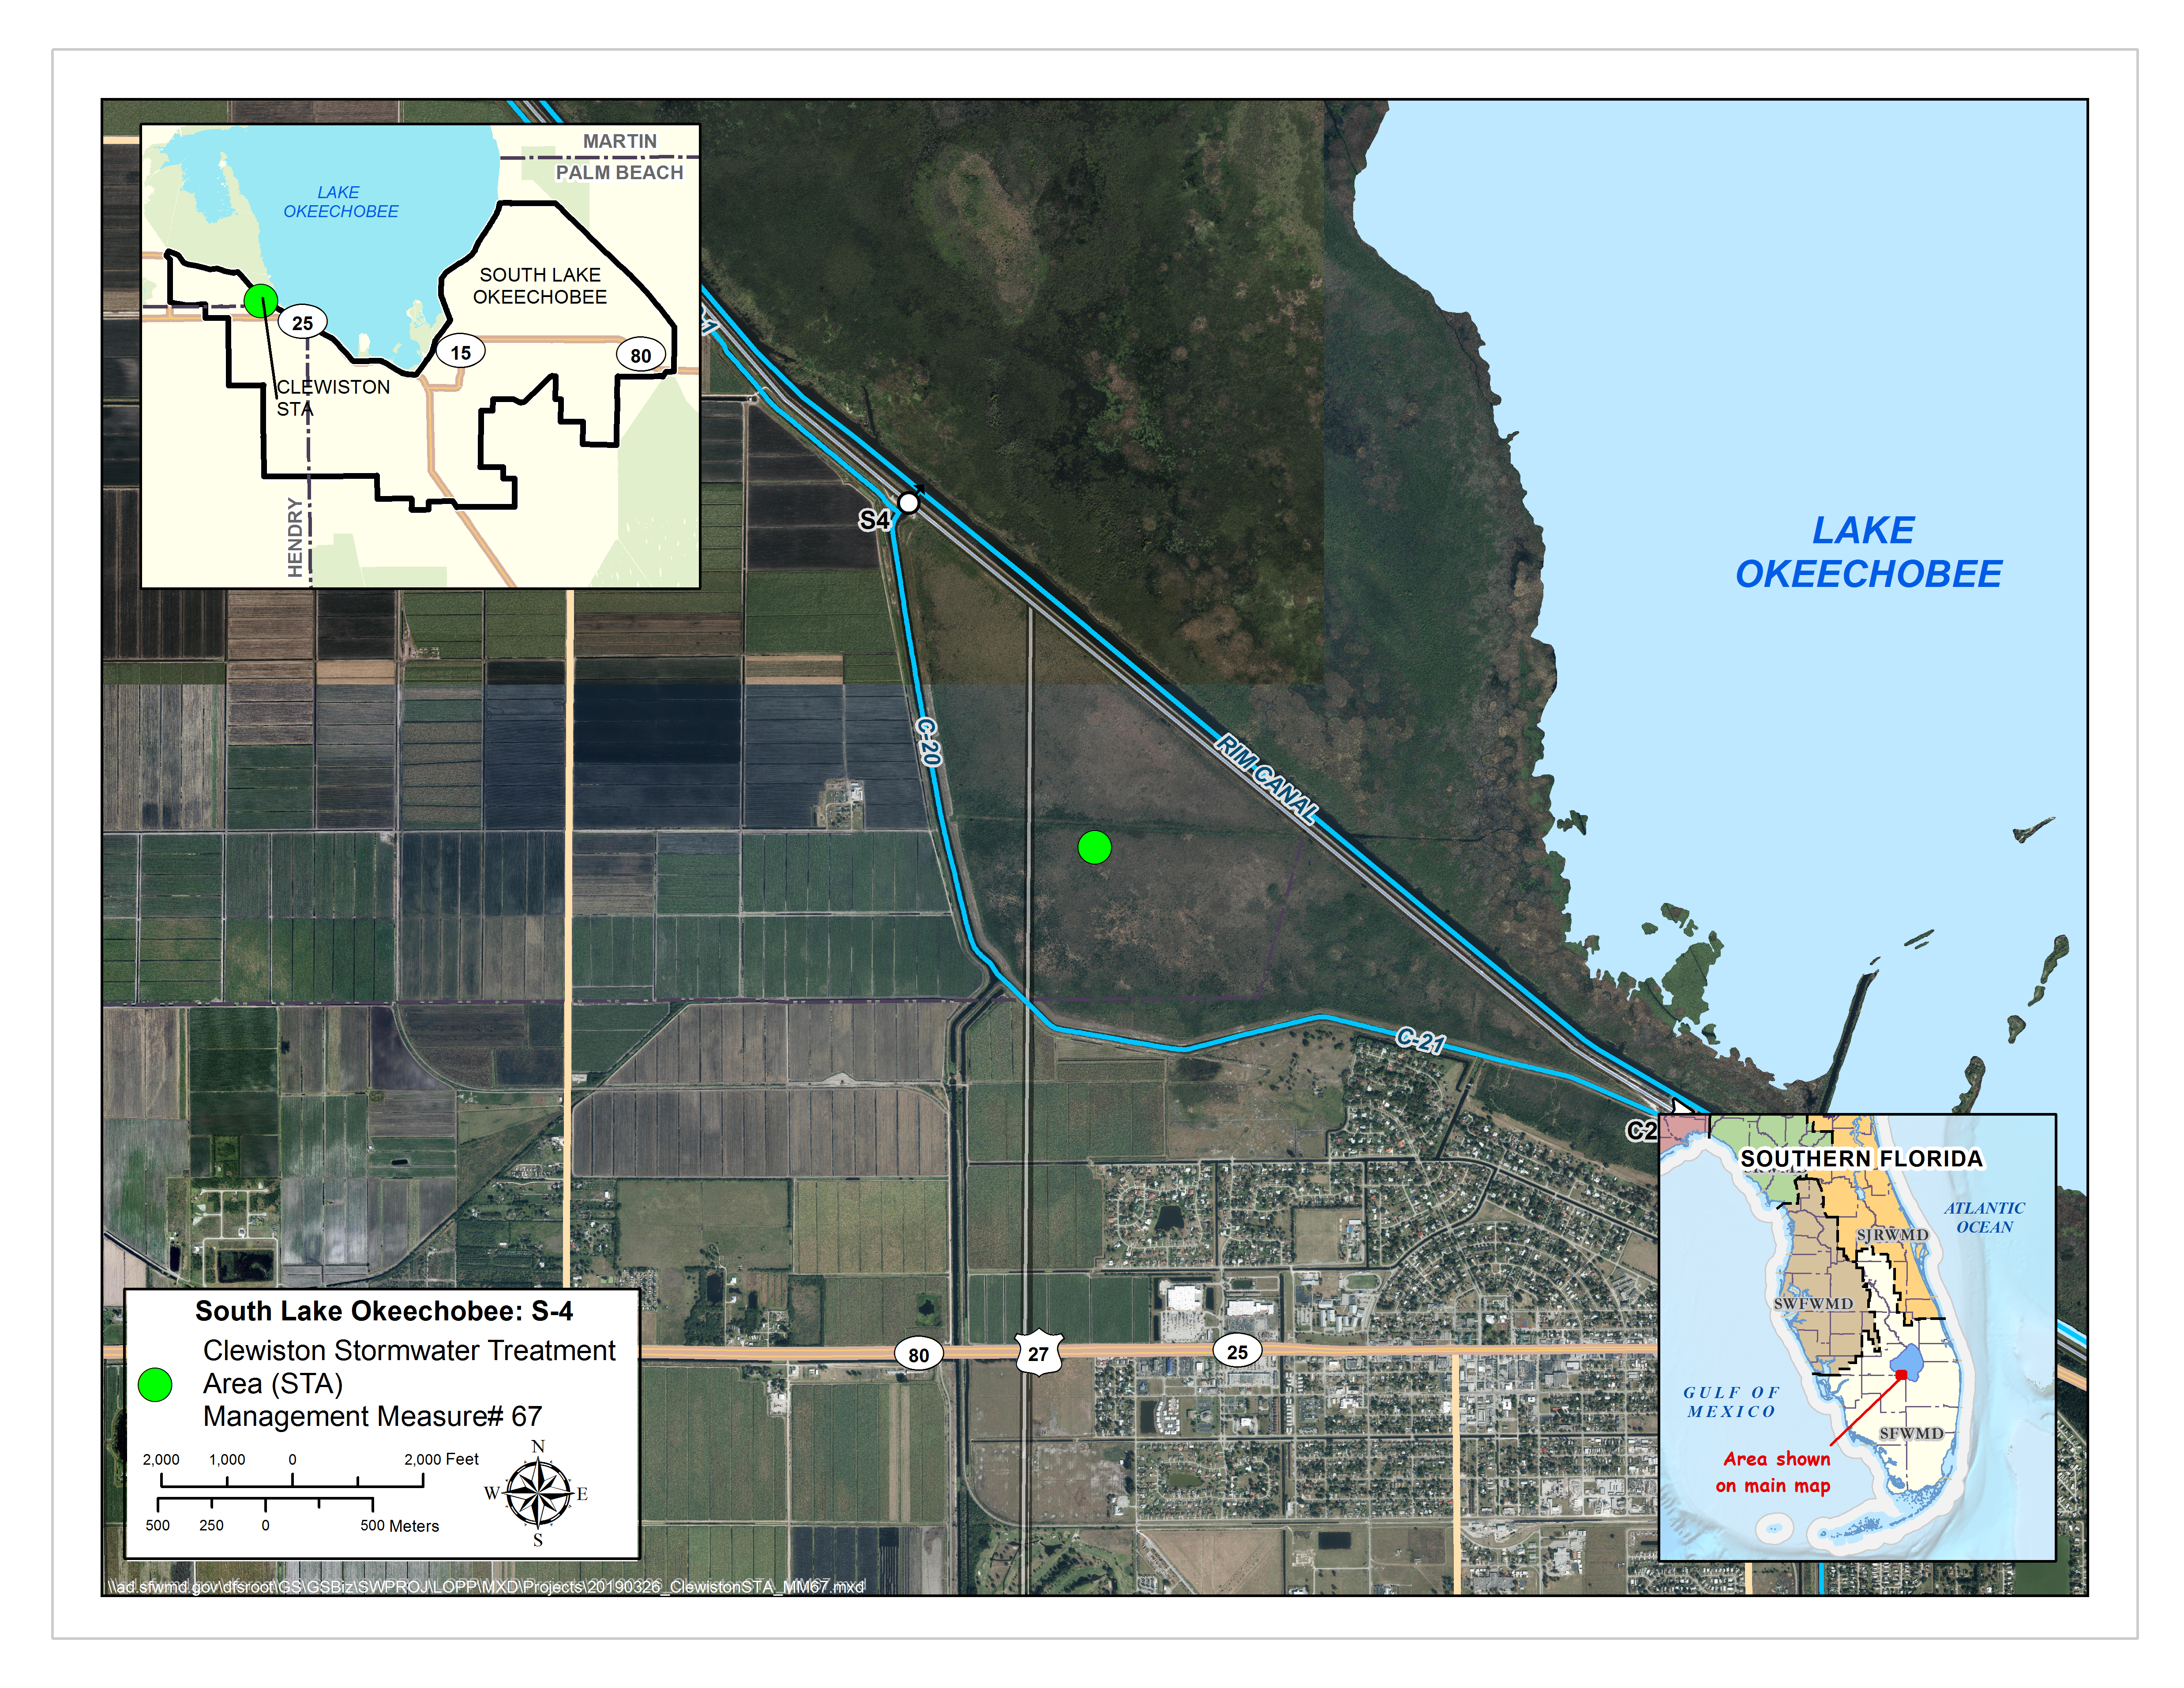 Purpose: Treat stormwater from the S4 Basin and surrounding area that is currently sent either to Lake Okeechobee (via Culvert 2, S-310 lock structure and/or S-4 Pump Station) or to the Caloosahatchee River (via S-235).
EAST LAKE OKEECHOBEE BASINS
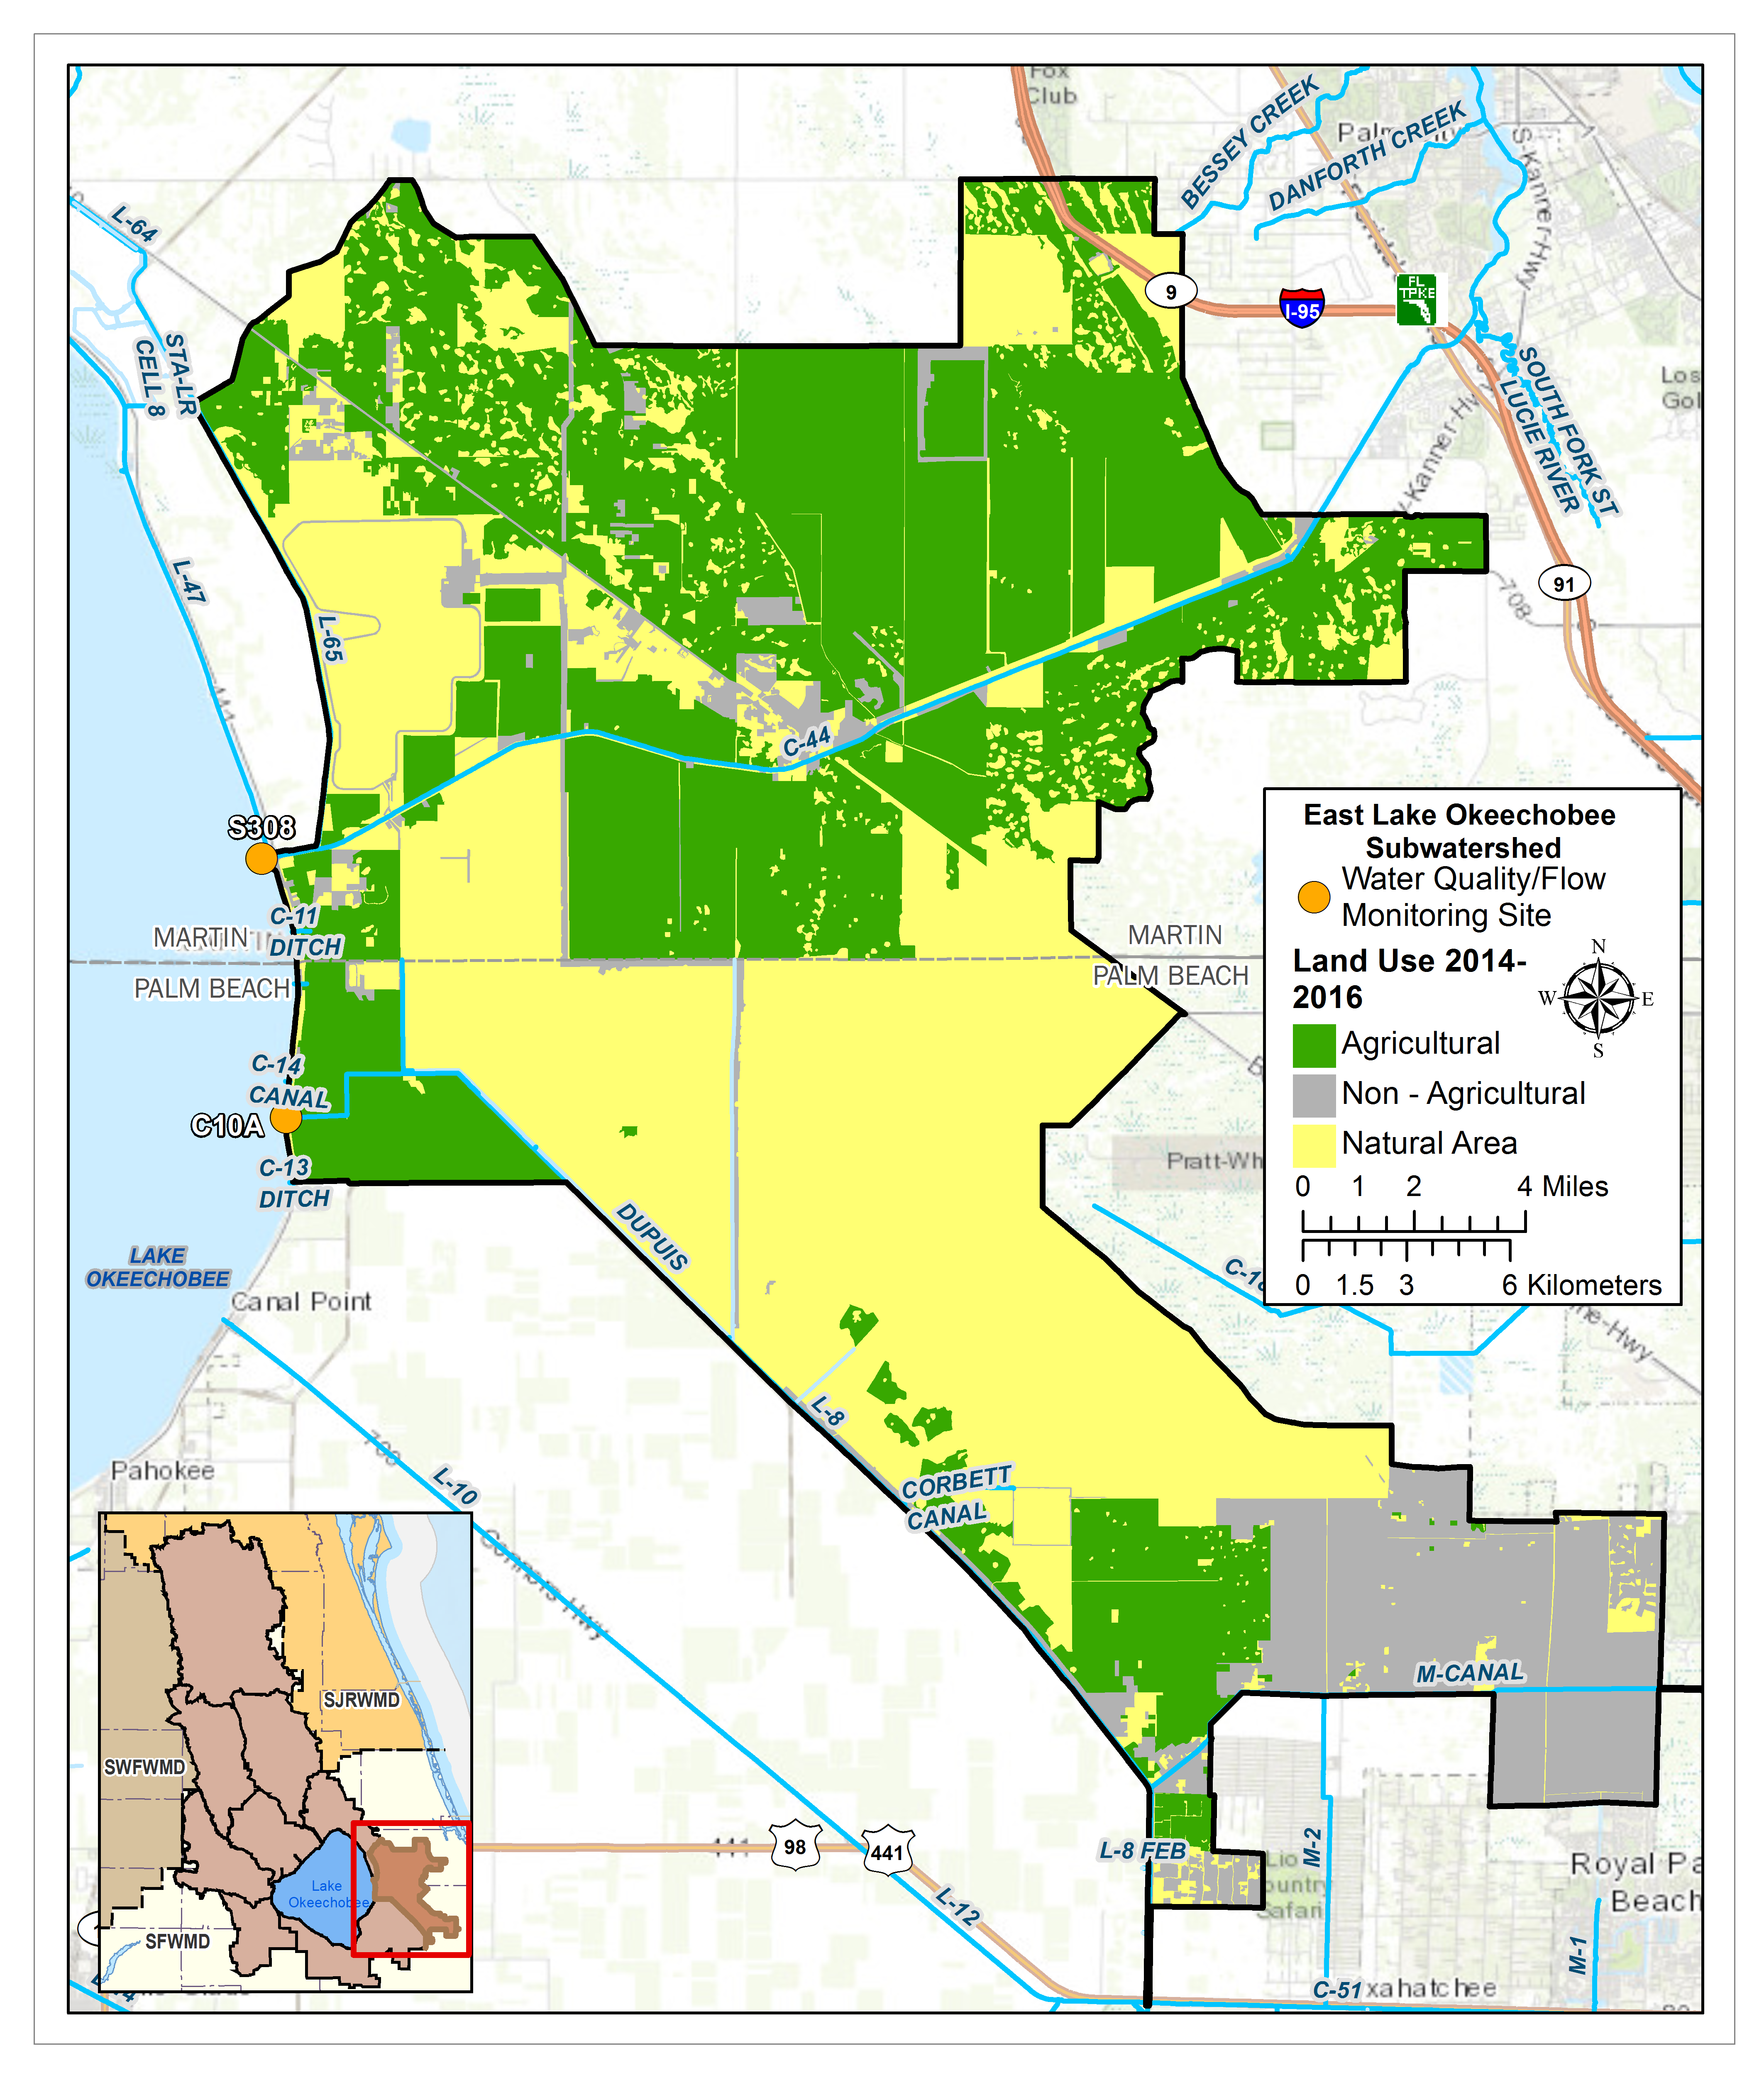
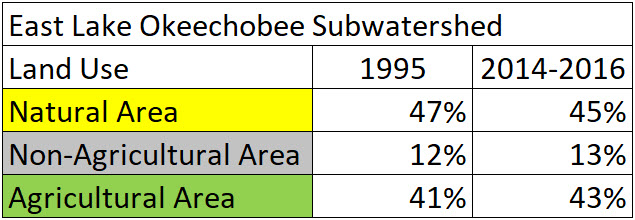
EAST LAKE OKEECHOBEE SUBWATERSHED
Total Area: 239,103ac
% Area of Lake Okeechobee Watershed: 6.9%
% TP Load of Lake Okeechobee Watershed: 4.3%
Monitoring Locations: S308, C10A

Flow Issues: No
- The East Lake Okeechobee subwatershed discharges to Lake Okeechobee, the St. Lucie River, and to the southeast away from Lake Okeechobee. This subwatershed discharges into the Lake via structures S-308 (C44 basin) and C10A (L8 basin). Flow and Load evaluations were conducted based only on that portion of flow that discharges from the East Lake Okeechobee subwatershed into Lake Okeechobee.
- Of the 9 subwatersheds, the East Lake Okeechobee subwatershed is responsible for only 4.5% of the flow contribution to Lake Okeechobee during the post-protection plan period. No statistically significant trends for flow were detected during any of the periods evaluated and there was not a statistically significant difference between the pre and post-protection plan periods flows.
Water Quality Issues: No
- Of the 9 subwatersheds, the East Lake Okeechobee subwatershed is the third lowest contributor of total phosphorus (TP) to Lake Okeechobee, responsible for only 4.3% of TP loads discharged to the Lake during the post-protection plan period. There were no statistically significant trends for TP Flow Weighted Mean Concentrations (FWMC) during the pre or post-protection plan periods.
- When comparing the pre to the post-protection plan period, there is no statistically significant difference between the TP loads.
>>Additional Technical Information
PROJECTS LOCATED IN THIS SUBWATERSHED
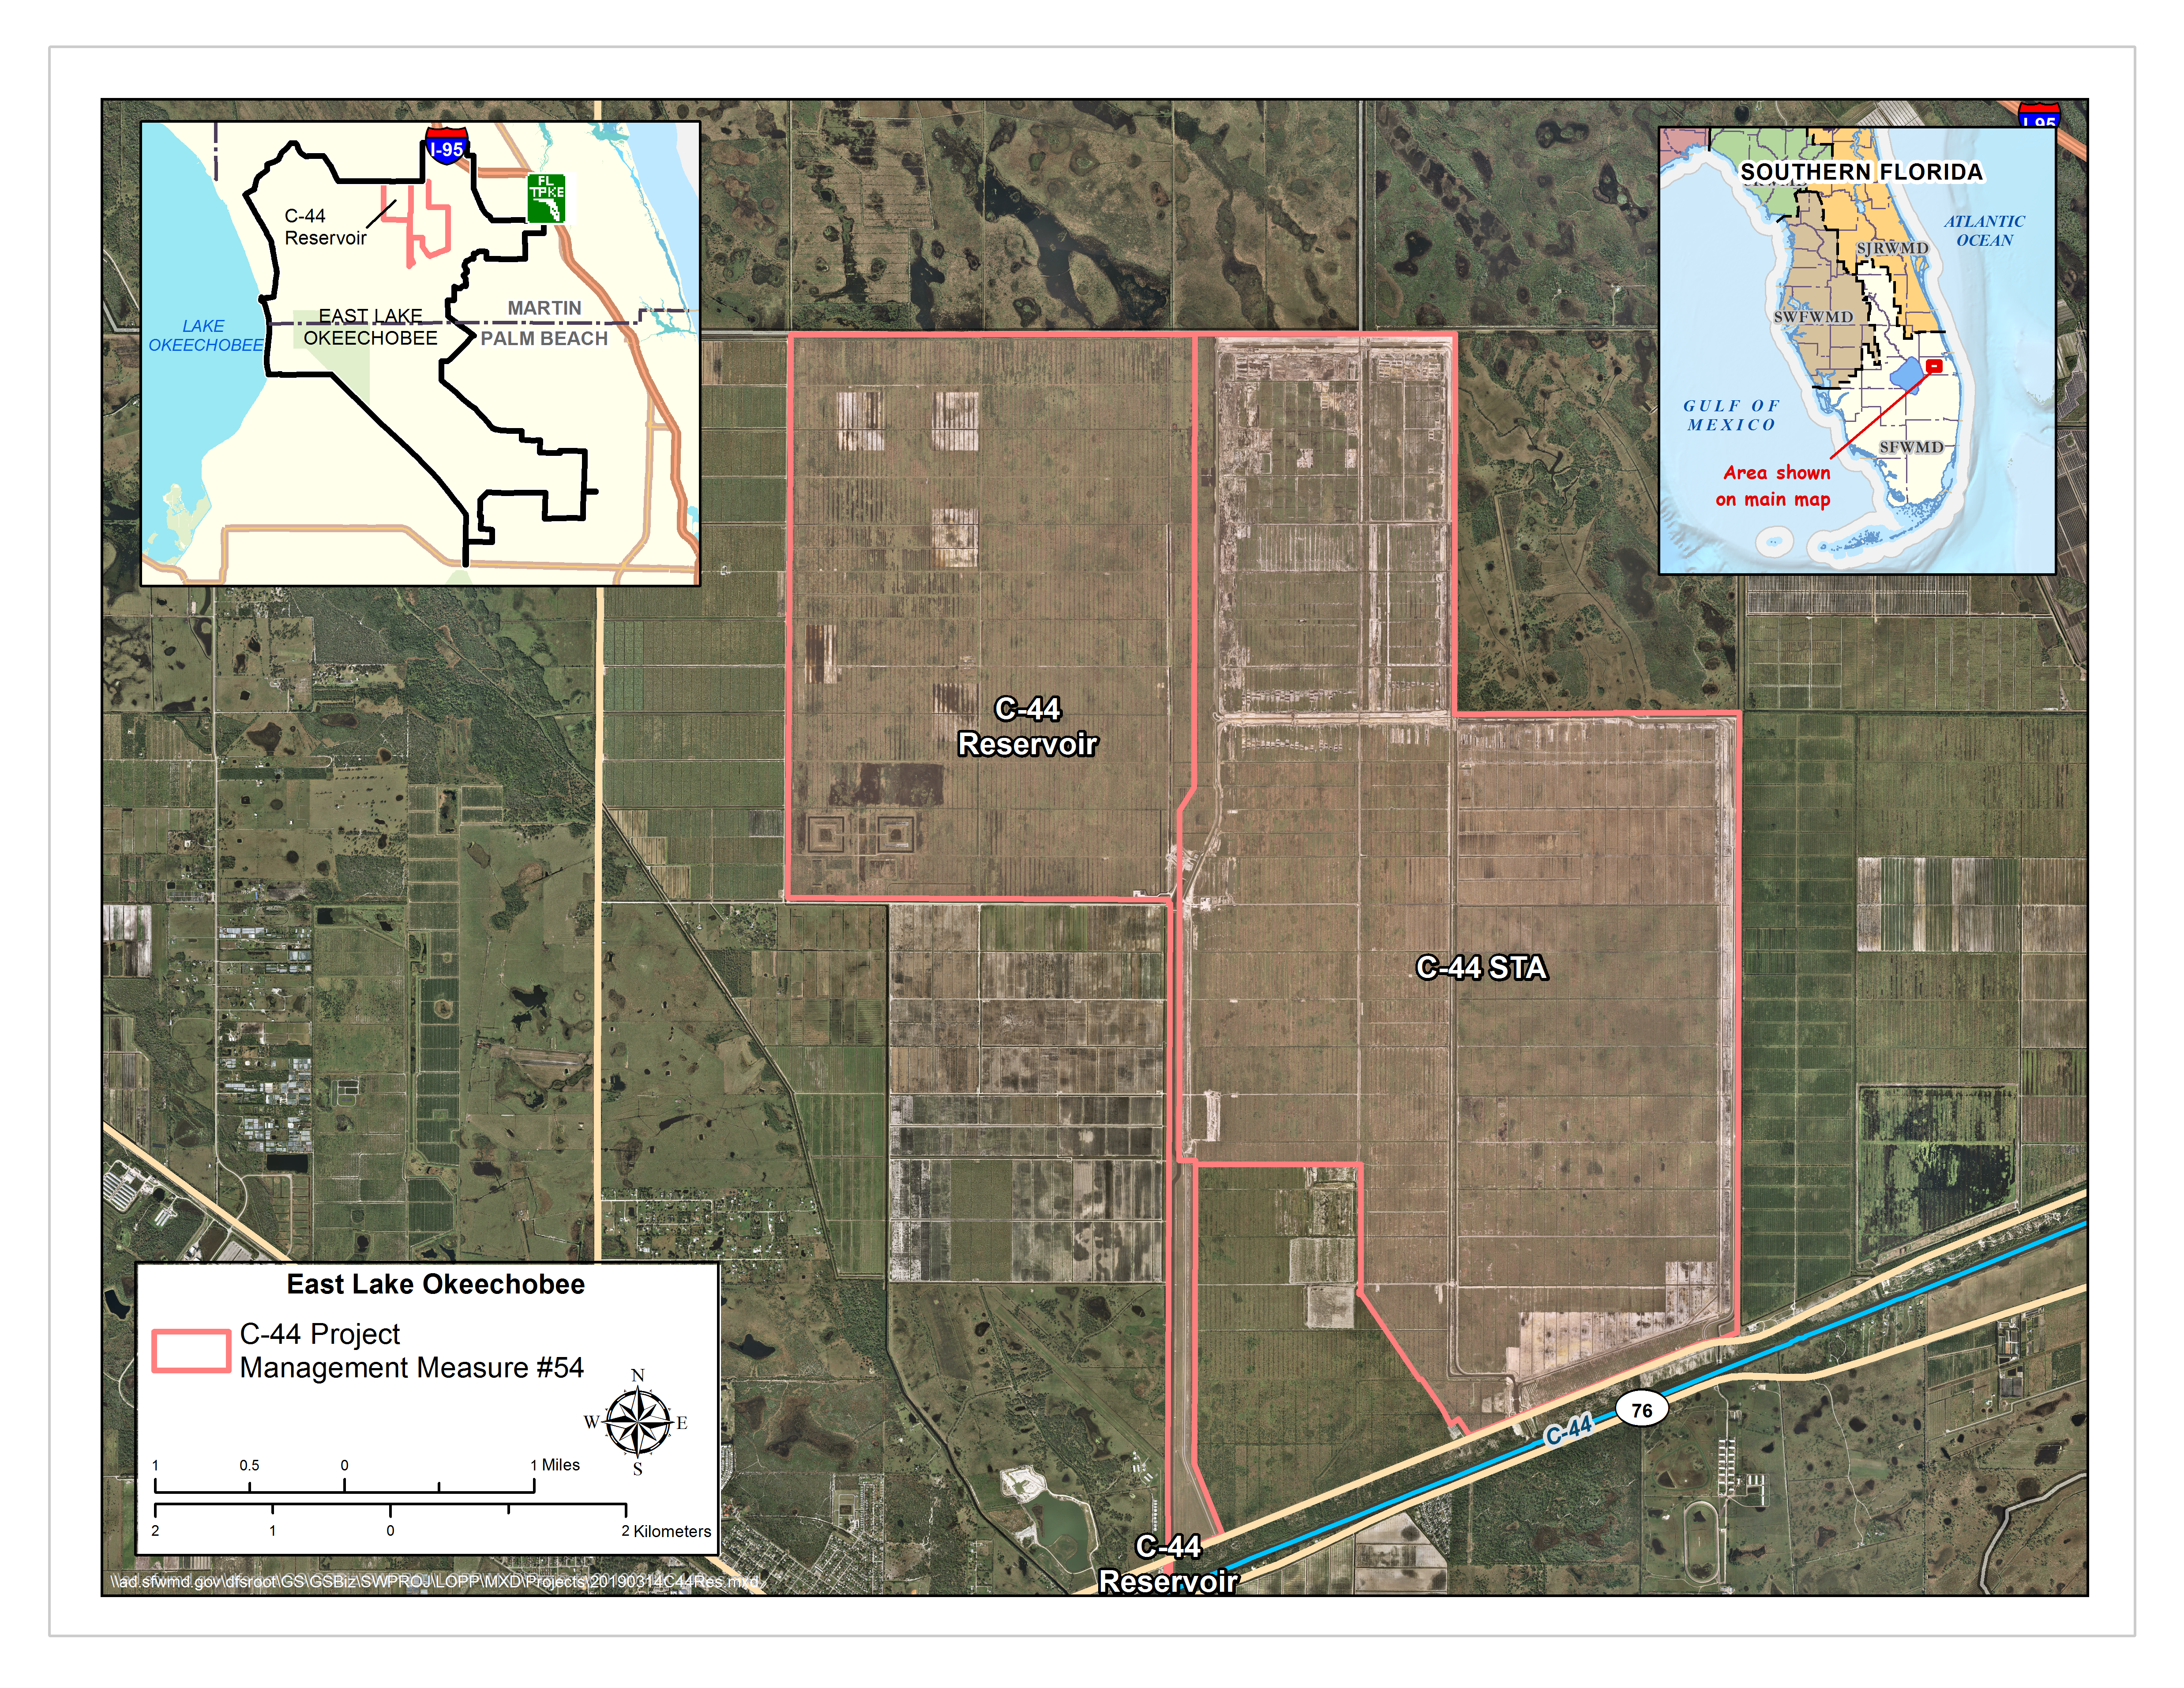 Purpose: Capture local runoff from the C-44 Basin, treat some or all of it via sedimentation and natural transformation of nutrients, and return it to the C-44 Canal when there is a need. The components are designed for flow attenuation to the St. Lucie Estuary, water quality benefits from reduced loading of nutrients, pesticides, herbicides, and other pollutants contained in runoff presently discharged to the estuary, and water supply benefits.
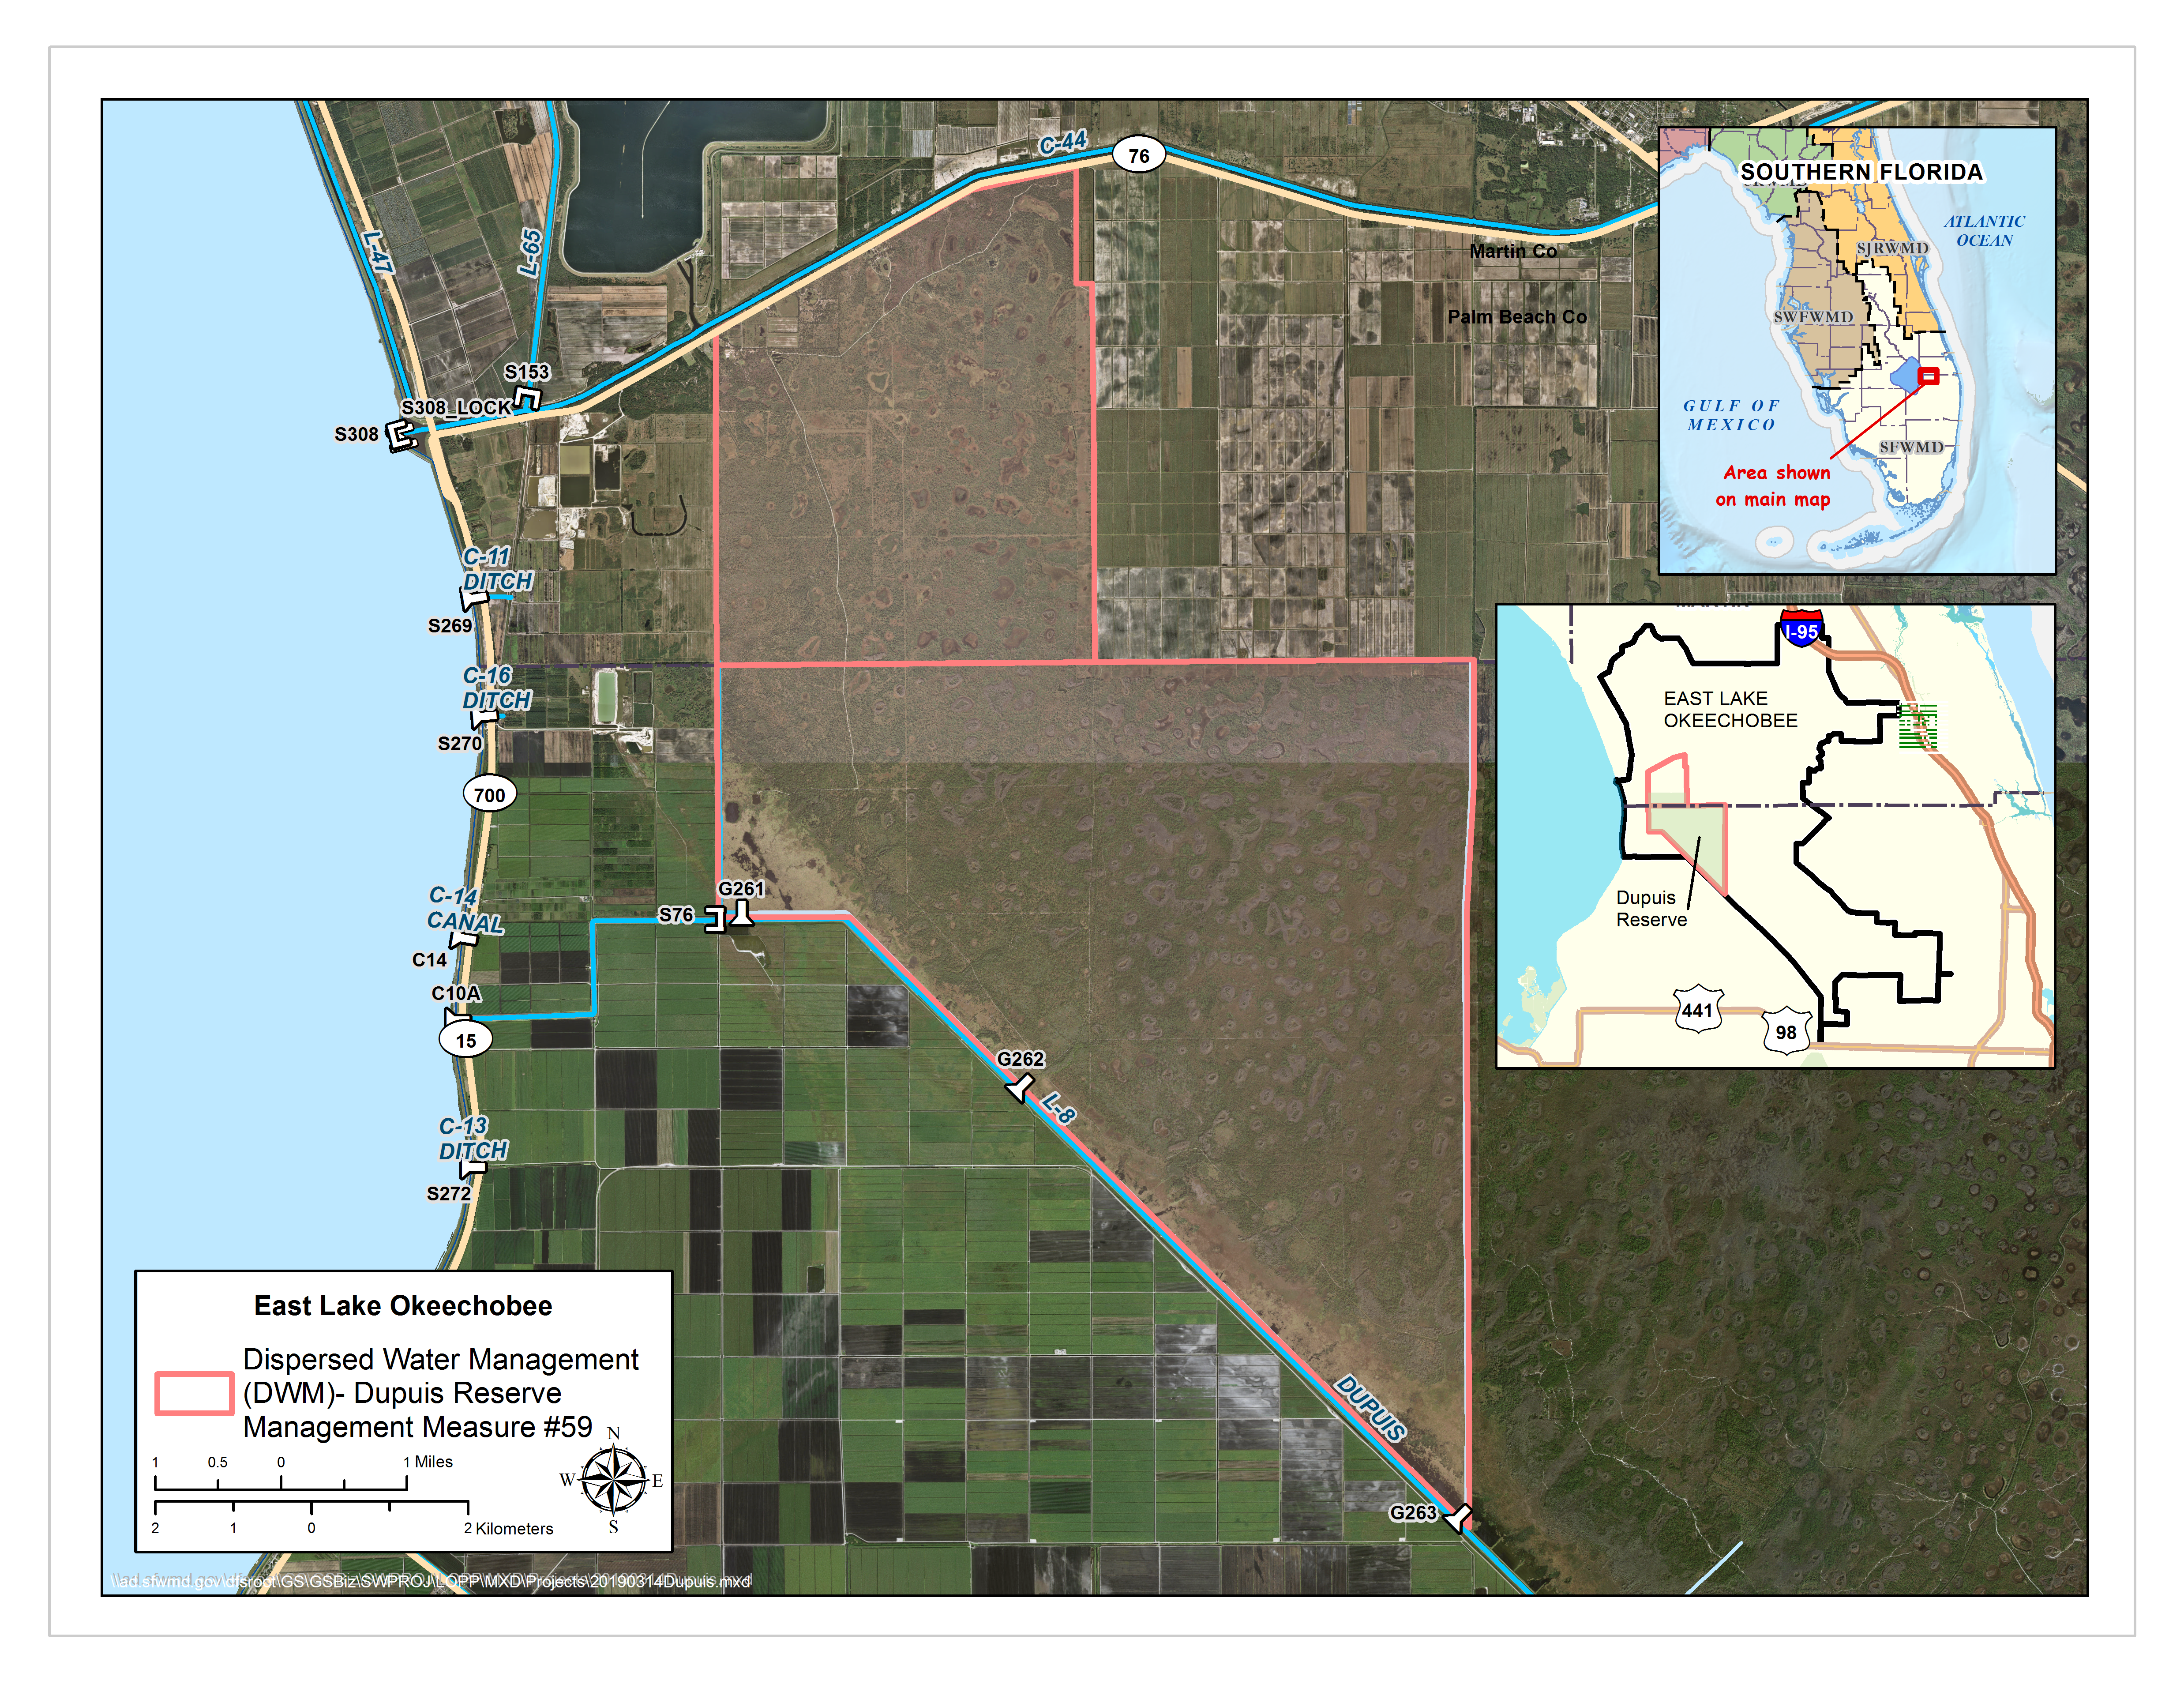 Purpose: Restore pre-drainage and enhance hydrologic conditions (improve hydroperiods) for approximately 21,858 acres of flatwoods and wetlands.
 Purpose: Reduce phosphorus exports to Lake Okeechobee in the four priority basins (S-65D, S-65E, S-154, and S-191).
WEST LAKE OKEECHOBEE BASINS
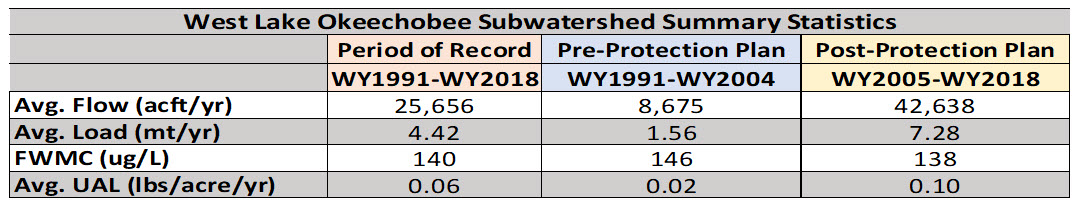
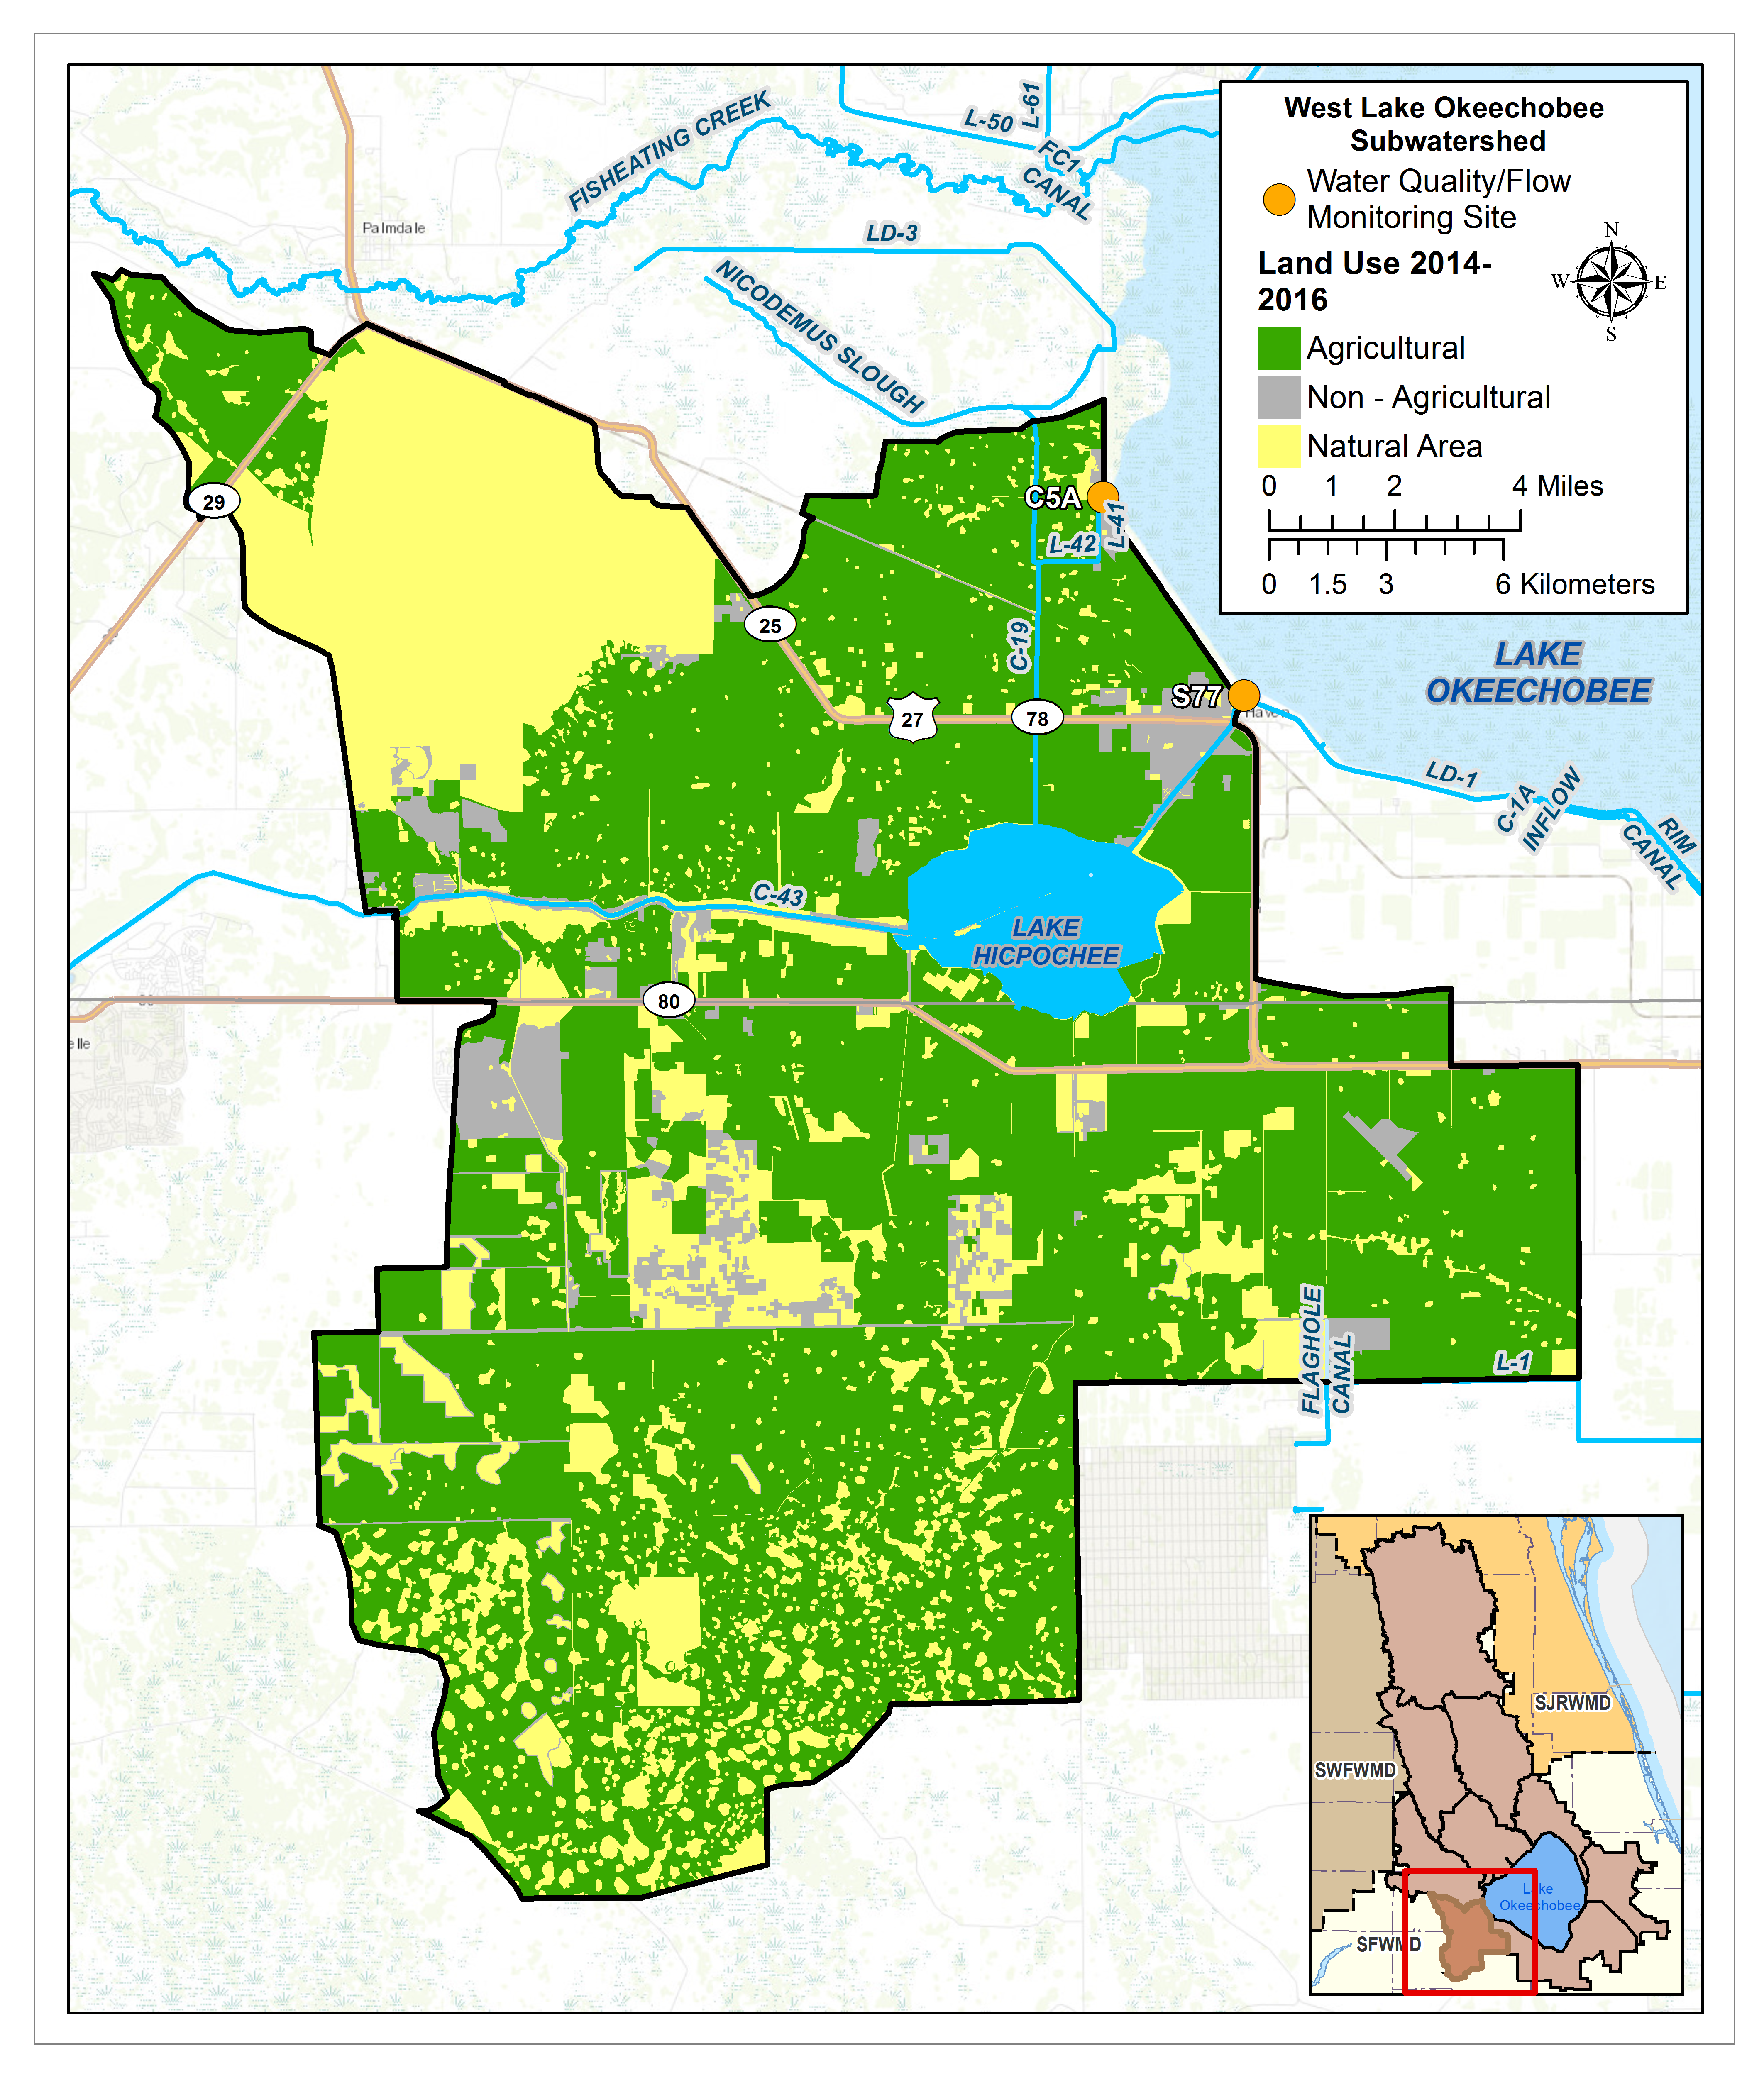
WEST LAKE OKEECHOBEE SUBWATERSHED
Total Area: 204,094ac
% Area of Lake Okeechobee Watershed: 5.9%
% TP Load of Lake Okeechobee Watershed: 1.4%
Monitoring Locations: C5A, S77
Flow Issues: No
- The analyses of water quality and flow data presented in this Technical Sheet only represent discharges to Lake Okeechobee at structure S77. Structure S78 is also a Basin outflow and is monitored; however, it discharges to the Caloosahatchee River and Estuary Watershed, thus was not included. There are other basin interconnections that are not monitored.
- Based on the limited discharge volume to Lake Okeechobee from this Subwatershed (1.8% during the post-protection plan period), this subwatershed is relatively lower priority for future projects from the Lake Okeechobee Restoration perspective.
- Since 2014, sampling has been suspended due to construction activity at C5A.
- There were no statistically significant trends for flows.
Water Quality Issues: No
- This subwatershed is a lower priority for water quality projects from the Lake Okeechobee Protection Plan perspective as it contributes a relatively smaller percentage of the total load to the lake (1.4% during the post-protection plan period) and has a relatively low total phosphorus flow weighted mean concentrations (138 µg/L during the post-protection plan period).
- There were no statistically significant trends for water quality.

>>Additional Technical Information
PROJECTS LOCATED IN THIS SUBWATERSHED
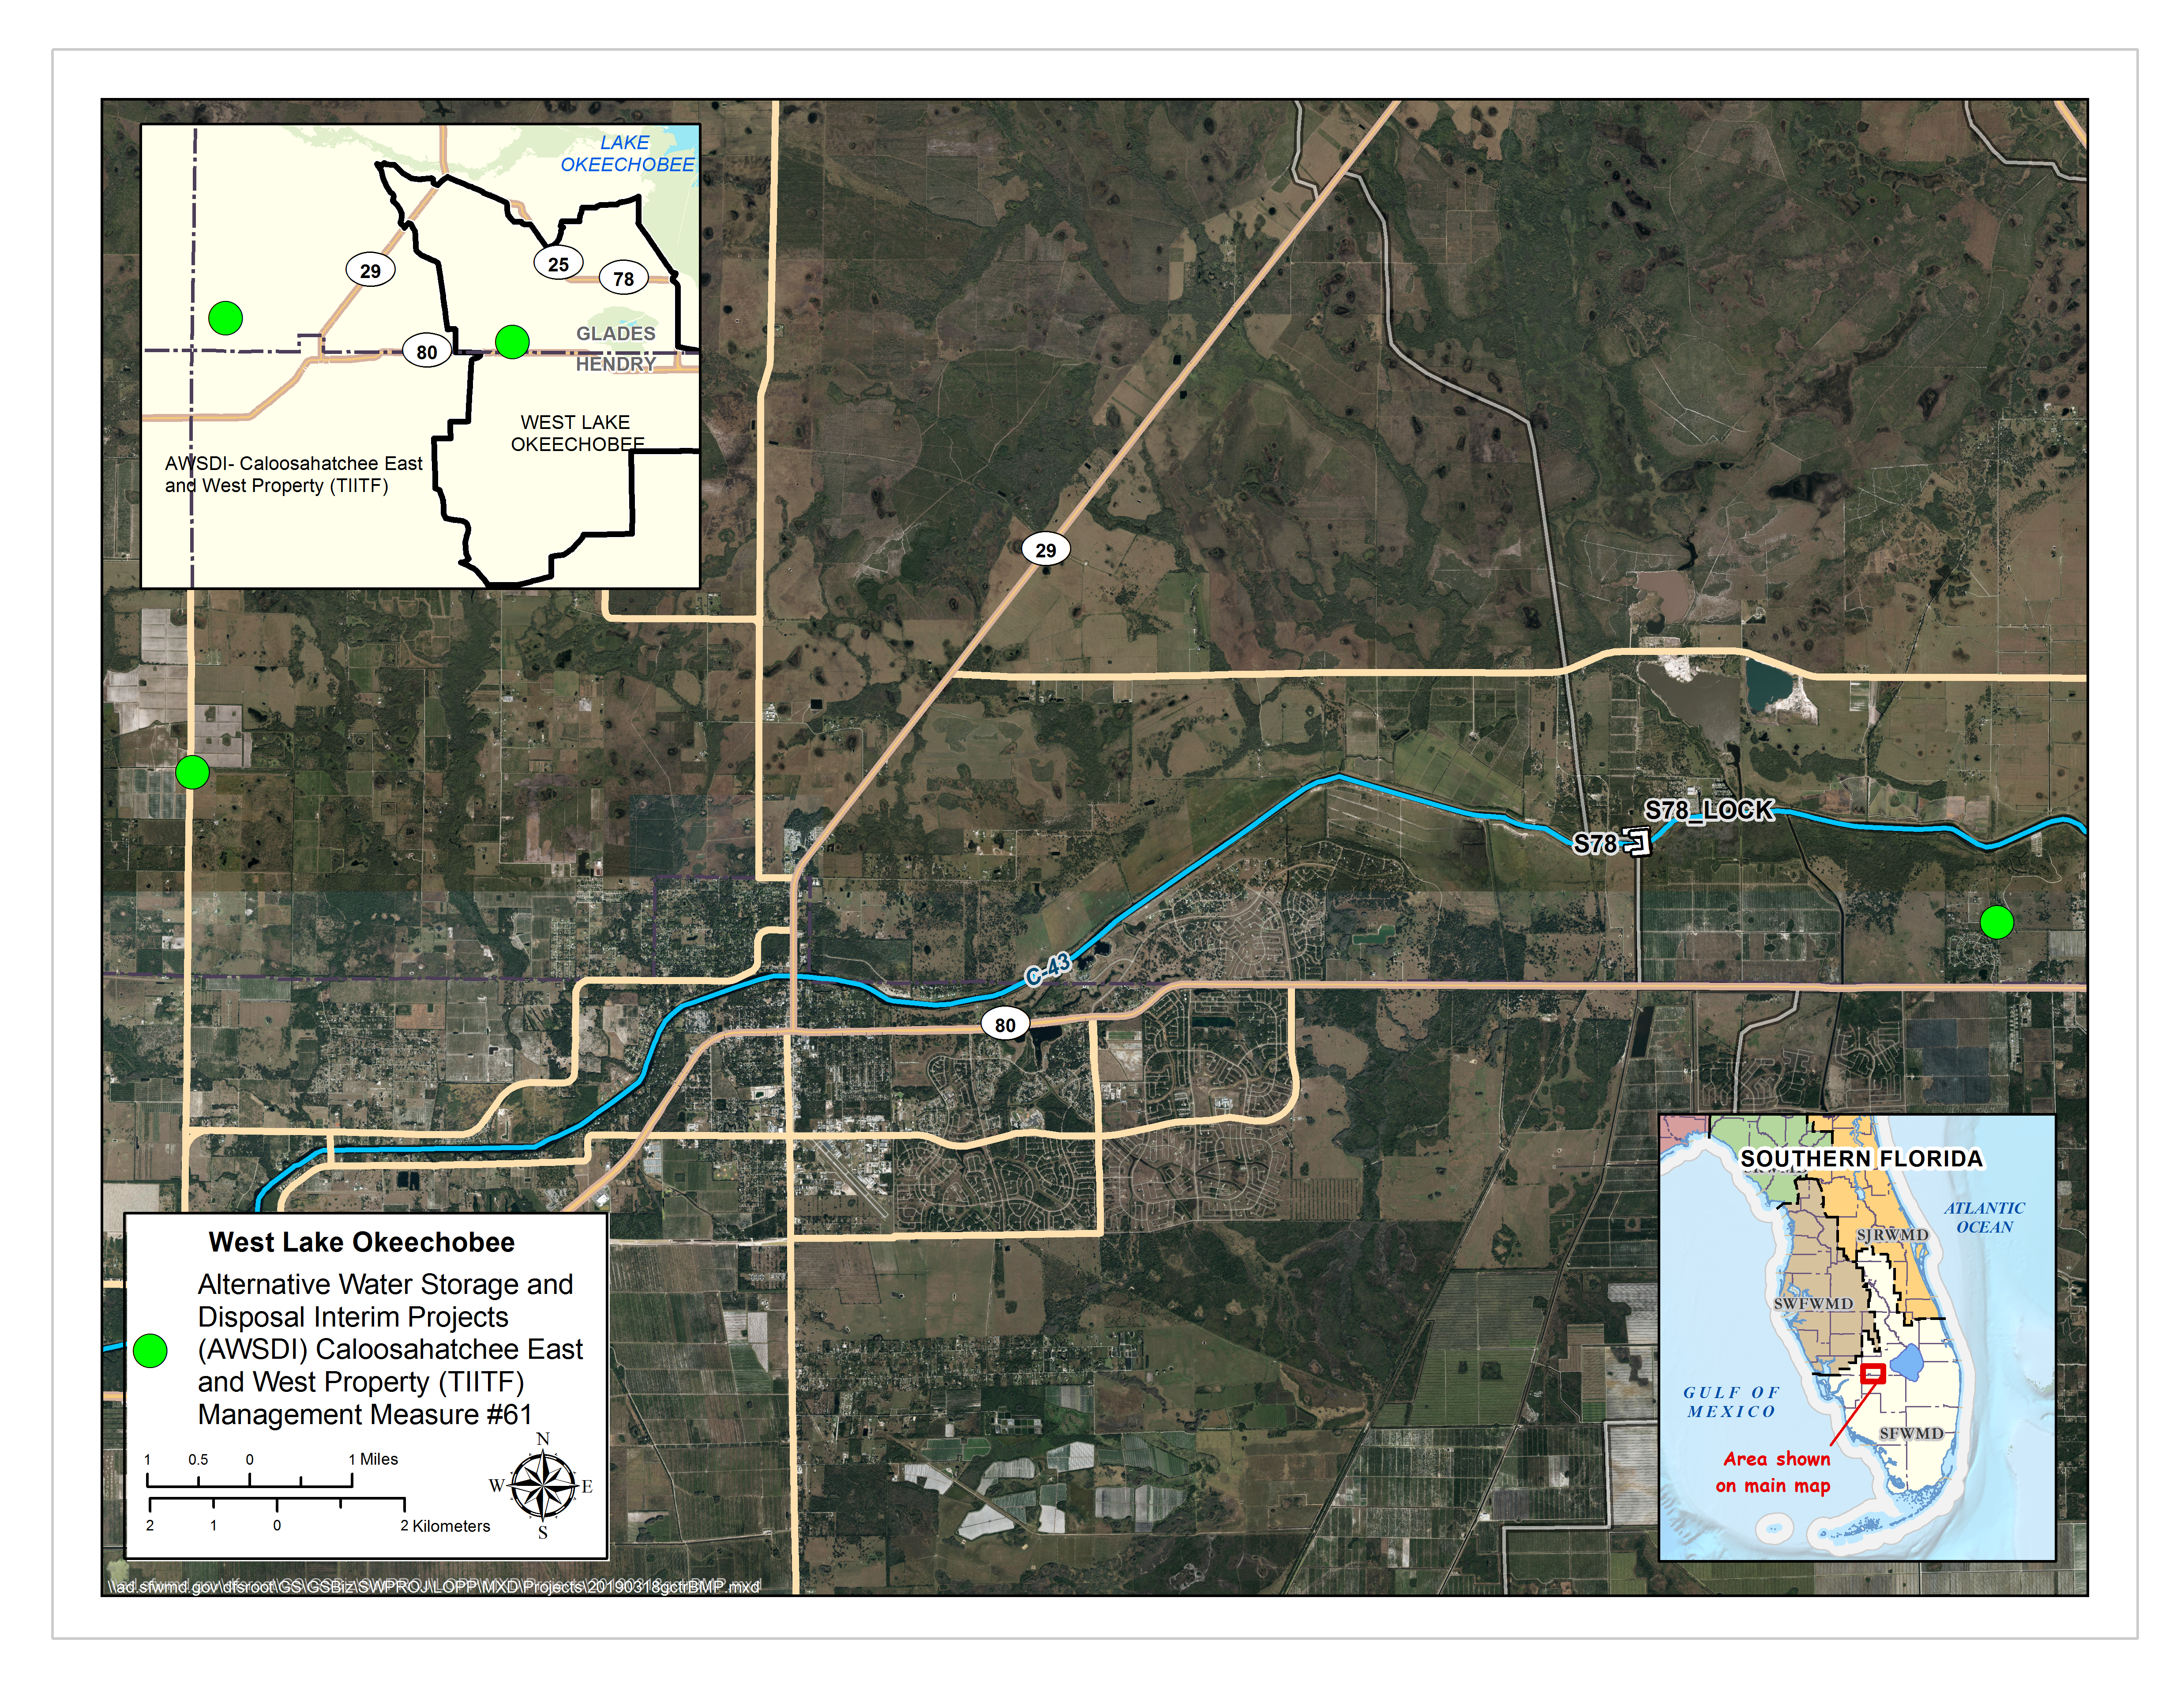 Purpose: Utilize interim facilities for water storage by employing a range of site alternative measures at a number of project sites. Alternatives include construction of on-site measures such as temporary ditch blocks, minor berms, minimal earthwork, wetland restoration, and potential water diversions to the project site using temporary pump facilities.